
Solaris Oilfield Infrastructure, Inc. (SOI): Price and Financial Metrics
SOI Price/Volume Stats
| Current price | $13.12 | 52-week high | $13.42 |
| Prev. close | $13.26 | 52-week low | $6.59 |
| Day low | $12.87 | Volume | 390,073 |
| Day high | $13.38 | Avg. volume | 390,506 |
| 50-day MA | $9.62 | Dividend yield | 3.74% |
| 200-day MA | $8.75 | Market Cap | 577.58M |
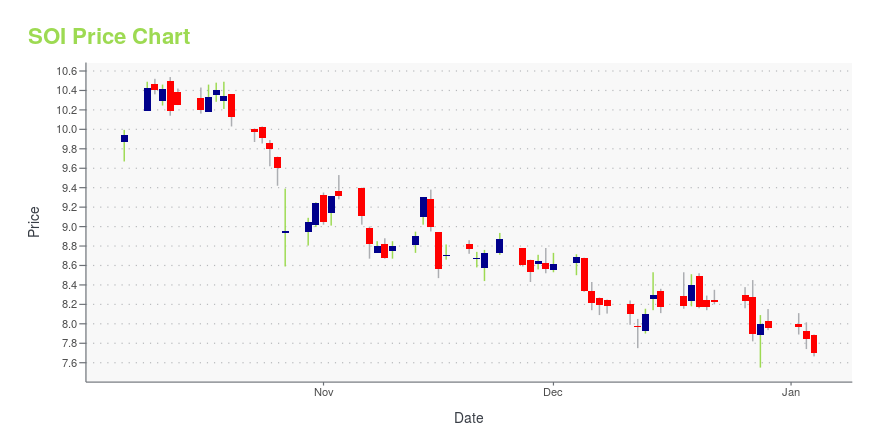
SOI Stock Price Chart Interactive Chart >
Solaris Oilfield Infrastructure, Inc. (SOI) Company Bio
Solaris Oilfield Infrastructure, Inc. manufactures and sells patented mobile proppant management systems to unload, store, and deliver proppant at oil and natural gas well sites in the United States. The company was founded in 2014 and is based in Houston, Texas.
Latest SOI News From Around the Web
Below are the latest news stories about SOLARIS OILFIELD INFRASTRUCTURE INC that investors may wish to consider to help them evaluate SOI as an investment opportunity.
Solaris Oilfield Infrastructure, Inc. (NYSE:SOI) Stock's Been Sliding But Fundamentals Look Decent: Will The Market Correct The Share Price In The Future?It is hard to get excited after looking at Solaris Oilfield Infrastructure's (NYSE:SOI) recent performance, when its... |
We Wouldn't Be Too Quick To Buy Solaris Oilfield Infrastructure, Inc. (NYSE:SOI) Before It Goes Ex-DividendIt looks like Solaris Oilfield Infrastructure, Inc. ( NYSE:SOI ) is about to go ex-dividend in the next 3 days. The... |
Solaris Oilfield Infrastructure (NYSE:SOI) Is Increasing Its Dividend To $0.12Solaris Oilfield Infrastructure, Inc. ( NYSE:SOI ) will increase its dividend from last year's comparable payment on... |
Does Solaris Oilfield Infrastructure (NYSE:SOI) Deserve A Spot On Your Watchlist?Investors are often guided by the idea of discovering 'the next big thing', even if that means buying 'story stocks... |
Solaris Oilfield Infrastructure (NYSE:SOI) Will Pay A Larger Dividend Than Last Year At $0.12Solaris Oilfield Infrastructure, Inc. ( NYSE:SOI ) has announced that it will be increasing its dividend from last... |
SOI Price Returns
| 1-mo | 55.63% |
| 3-mo | 38.04% |
| 6-mo | 71.86% |
| 1-year | 50.63% |
| 3-year | 66.96% |
| 5-year | 23.95% |
| YTD | 69.70% |
| 2023 | -15.75% |
| 2022 | 57.46% |
| 2021 | -15.55% |
| 2020 | -38.09% |
| 2019 | 19.10% |
SOI Dividends
| Ex-Dividend Date | Type | Payout Amount | Change | ||||||
|---|---|---|---|---|---|---|---|---|---|
| Loading, please wait... | |||||||||
Continue Researching SOI
Want to see what other sources are saying about Solaris Oilfield Infrastructure Inc's financials and stock price? Try the links below:Solaris Oilfield Infrastructure Inc (SOI) Stock Price | Nasdaq
Solaris Oilfield Infrastructure Inc (SOI) Stock Quote, History and News - Yahoo Finance
Solaris Oilfield Infrastructure Inc (SOI) Stock Price and Basic Information | MarketWatch
Loading social stream, please wait...