Sonoco Products Company (SON): Price and Financial Metrics
SON Price/Volume Stats
Current price | $57.64 | 52-week high | $63.74 |
Prev. close | $56.64 | 52-week low | $49.98 |
Day low | $56.88 | Volume | 562,700 |
Day high | $57.68 | Avg. volume | 446,080 |
50-day MA | $57.01 | Dividend yield | 3.62% |
200-day MA | $56.17 | Market Cap | 5.66B |
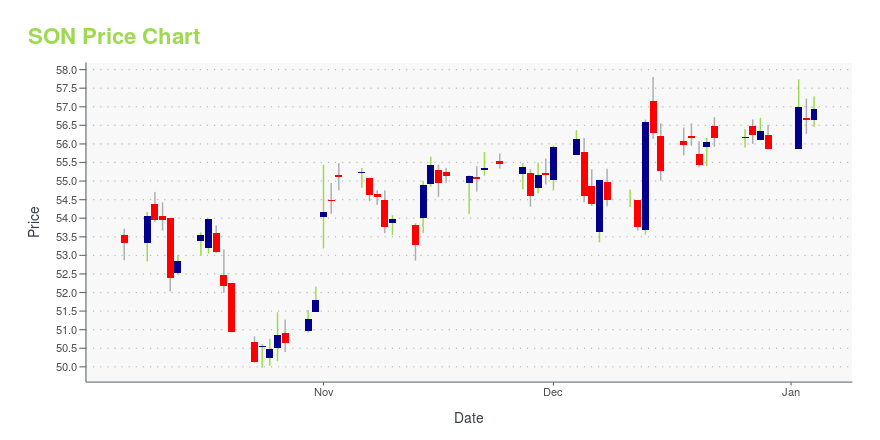
SON Stock Price Chart Interactive Chart >
SON POWR Grades
- SON scores best on the Sentiment dimension, with a Sentiment rank ahead of 92.04% of US stocks.
- The strongest trend for SON is in Stability, which has been heading up over the past 26 weeks.
- SON ranks lowest in Growth; there it ranks in the 54th percentile.
SON Stock Summary
- SONOCO PRODUCTS CO's stock had its IPO on January 1, 1986, making it an older stock than 92.92% of US equities in our set.
- Of note is the ratio of SONOCO PRODUCTS CO's sales and general administrative expense to its total operating expenses; 98.09% of US stocks have a lower such ratio.
- The volatility of SONOCO PRODUCTS CO's share price is greater than that of merely 6.08% US stocks with at least 200 days of trading history.
- Stocks with similar financial metrics, market capitalization, and price volatility to SONOCO PRODUCTS CO are AWI, BBCP, REYN, HEES, and JBI.
- Visit SON's SEC page to see the company's official filings. To visit the company's web site, go to www.sonoco.com.
SON Valuation Summary
- In comparison to the median Consumer Cyclical stock, SON's price/earnings ratio is 36.57% lower, now standing at 11.1.
- SON's price/sales ratio has moved down 0.1 over the prior 243 months.
Below are key valuation metrics over time for SON.
Stock | Date | P/S | P/B | P/E | EV/EBIT |
---|---|---|---|---|---|
SON | 2023-12-29 | 0.8 | 2.3 | 11.1 | 11.6 |
SON | 2023-12-28 | 0.8 | 2.4 | 11.2 | 11.7 |
SON | 2023-12-27 | 0.8 | 2.4 | 11.2 | 11.7 |
SON | 2023-12-26 | 0.8 | 2.4 | 11.2 | 11.7 |
SON | 2023-12-22 | 0.8 | 2.4 | 11.2 | 11.7 |
SON | 2023-12-21 | 0.8 | 2.4 | 11.2 | 11.6 |
SON Growth Metrics
- Its 3 year cash and equivalents growth rate is now at 21.88%.
- Its 5 year revenue growth rate is now at 12.62%.
- Its 4 year price growth rate is now at -10.82%.
The table below shows SON's growth in key financial areas (numbers in millions of US dollars).
Date | Revenue | Operating Cash Flow | Net Income to Common Stock |
---|---|---|---|
2022-12-31 | 7,250.552 | 509.049 | 466.437 |
2022-09-30 | 7,013.717 | 400.649 | 434.391 |
2022-06-30 | 6,538.694 | 381.184 | 423.302 |
2022-03-31 | 6,008.116 | 161.017 | -42.44 |
2021-12-31 | 5,590.438 | 298.672 | -85.477 |
2021-09-30 | 5,527.599 | 436.198 | -162.275 |
SON's Quality Factors
The “Quality” component of the POWR Ratings focuses on 31 different factors of a companies fundamentals and operational strength. Here are some key insights as we drill into the specifics of these quality attributes.- SON has a Quality Grade of B, ranking ahead of 77.85% of graded US stocks.
- SON's asset turnover comes in at 1.08 -- ranking 2nd of 11 Shipping Containers stocks.
- PKG, GEF, and WRK are the stocks whose asset turnover ratios are most correlated with SON.
The table below shows SON's key quality metrics over time.
Period | Asset Turnover | Gross Margin | ROIC |
---|---|---|---|
2021-10-03 | 1.080 | 0.194 | -0.051 |
2021-07-04 | 1.018 | 0.198 | -0.056 |
2021-04-04 | 0.959 | 0.200 | 0.087 |
2020-12-31 | 0.961 | 0.200 | 0.088 |
2020-09-27 | 0.955 | 0.197 | 0.104 |
2020-06-28 | 0.999 | 0.197 | 0.116 |
SON Price Target
For more insight on analysts targets of SON, see our SON price target page. And for a list of of all stocks sorted by upside potential based on analyst target price, see our Top Price Target page.
Average Price Target | $65.50 | Average Broker Recommendation | 2.1 (Hold) |
Sonoco Products Company (SON) Company Bio
Sonoco Products is a provider of a variety of consumer packaging, industrial products, protective packaging and packaging supply chain services. The company was founded in 1899 and is based in Hartsville, South Carolina.
Latest SON News From Around the Web
Below are the latest news stories about SONOCO PRODUCTS CO that investors may wish to consider to help them evaluate SON as an investment opportunity.
Sonoco Implementing Price Increase for all Paperboard Converted ProductsHARTSVILLE, S.C., Dec. 18, 2023 (GLOBE NEWSWIRE) -- Sonoco (NYSE: SON) today announced it will raise the price for all converted paperboard products by a minimum of 6 percent, effective with shipments in the United States and Canada, on or after February 1, 2024. “This price increase is necessary due to continued increases in costs for uncoated recycled paperboard (URB), our primary raw material,” said Mike Thompson, Vice President of Sales and Marketing for Sonoco’s North American Converted Pap |
Sonoco Products Company (NYSE:SON) Shares Could Be 41% Below Their Intrinsic Value EstimateKey Insights Sonoco Products' estimated fair value is US$95.44 based on 2 Stage Free Cash Flow to Equity Sonoco... |
With Stocks Like Sonoco Available, Why Buy Bonds or CDs?People were going crazy recently, locking in six-month certificates of deposit and 10-year bonds to secure 4% -5% yields. Over the most recent decade, SON saw solid gains across the board, while also retiring over 5% of all outstanding shares using free cash flow to do so. Amazingly, SON's greater than 121.7% EPS gain only generated a 34% absolute price rise and 60.8% in total return. |
Sonoco Implementing Price Increase for Uncoated Recycled PaperboardHARTSVILLE, S.C., Dec. 13, 2023 (GLOBE NEWSWIRE) -- Sonoco (NYSE: SON) today announced it is implementing a $50 per ton price increase for all grades of uncoated recycled paperboard (URB) in the United States and Canada, effective with shipments beginning February 1, 2024. This price action is necessary to offset increased input costs. Contact Information: Lisa Weeks Vice President of Investor Relations & Communications [email protected] 843-383-7524 About Sonoco Founded in 1899, Sonoco (NYS |
Sonoco (SON) Buys Inapel to Boost Its Packaging PortfolioSonoco (SON) acquires Brazil-based packaging manufacturer, Inapel. |
SON Price Returns
1-mo | 2.29% |
3-mo | 4.10% |
6-mo | 8.02% |
1-year | 0.05% |
3-year | -0.52% |
5-year | 9.90% |
YTD | 4.10% |
2023 | -4.69% |
2022 | 8.30% |
2021 | 0.53% |
2020 | -0.73% |
2019 | 19.53% |
SON Dividends
Ex-Dividend Date | Type | Payout Amount | Change | ||||||
---|---|---|---|---|---|---|---|---|---|
Loading, please wait... |
Continue Researching SON
Here are a few links from around the web to help you further your research on Sonoco Products Co's stock as an investment opportunity:Sonoco Products Co (SON) Stock Price | Nasdaq
Sonoco Products Co (SON) Stock Quote, History and News - Yahoo Finance
Sonoco Products Co (SON) Stock Price and Basic Information | MarketWatch
Loading social stream, please wait...