
Sonim Technologies, Inc. (SONM): Price and Financial Metrics
SONM Price/Volume Stats
| Current price | $3.45 | 52-week high | $11.00 |
| Prev. close | $3.38 | 52-week low | $3.24 |
| Day low | $3.37 | Volume | 12,996 |
| Day high | $3.50 | Avg. volume | 29,858 |
| 50-day MA | $6.08 | Dividend yield | N/A |
| 200-day MA | $6.58 | Market Cap | 161.18M |
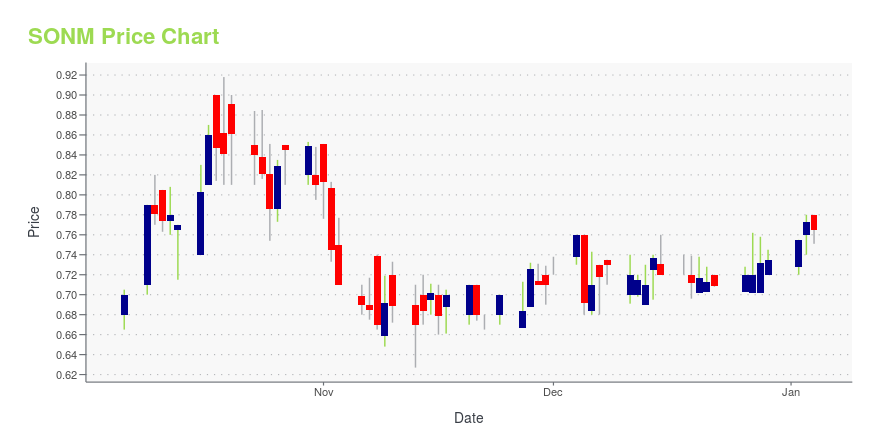
SONM Stock Price Chart Interactive Chart >
Sonim Technologies, Inc. (SONM) Company Bio
Sonim Technologies, Inc. engages in the design and manufacture of mission-critical smart phone-based solutions for workers in extreme, hazardous, and isolated environments. Its products include ultra-rugged mobile phones, business process applications, and a suite of industrial-grade accessories. The company was founded by Ram Chandran, Isaac Eteminan, Anush Gopalan, Jai Kumar, Sudu Srinivasan, and Joakim Wiklund on August 5, 1999 and is headquartered in San Mateo, CA.
Latest SONM News From Around the Web
Below are the latest news stories about SONIM TECHNOLOGIES INC that investors may wish to consider to help them evaluate SONM as an investment opportunity.
Sonim Technologies, Inc.'s (NASDAQ:SONM) Stock is Soaring But Financials Seem Inconsistent: Will The Uptrend Continue?Most readers would already be aware that Sonim Technologies' (NASDAQ:SONM) stock increased significantly by 15% over... |
Sidoti Events, LLC's Virtual December Small-Cap ConferenceNEW YORK, NY / ACCESSWIRE / December 5, 2023 / Sidoti Events, LLC, an affiliate of Sidoti & Company, LLC, has released the presentation schedule and weblinks for its two-day December Small-Cap Conference taking place Wednesday and Thursday, December ... |
Sonim Technologies to Present at the Sidoti Virtual Investor Conference December 7Group Presentation to be Available on Sonim Website San Diego, California--(Newsfile Corp. - December 1, 2023) - Sonim Technologies (NASDAQ: SONM) today announced it will present to investors at the Sidoti Small Cap Virtual Conference to be held December 6-7, 2023. Company management will also be available for individual meetings with qualified investors throughout the day. As part of the conference, Sonim is scheduled to provide a group presentation at 10:45 a.m. ET on December ... |
Sonim Technologies Third Quarter 2023 Earnings: EPS: US$0.013 (vs US$0.045 loss in 3Q 2022)Sonim Technologies ( NASDAQ:SONM ) Third Quarter 2023 Results Key Financial Results Revenue: US$27.6m (up 35% from 3Q... |
Sonim Appoints Mike Mulica as Board ChairSan Diego, California--(Newsfile Corp. - November 15, 2023) - Sonim Technologies, Inc. (NASDAQ: SONM), a leading provider of ultra-rugged, rugged and consumer durable mobile devices including phones, tablets and accessories designed to provide extra protection for users that demand more durability in their work and everyday lives, today announced that the board of directors of Sonim appointed Mike Mulica as its new Chair on November 12, 2023. Mr. Mulica will be succeeding Jeffrey ... |
SONM Price Returns
| 1-mo | -66.83% |
| 3-mo | -29.43% |
| 6-mo | -53.38% |
| 1-year | -66.83% |
| 3-year | -91.86% |
| 5-year | -99.73% |
| YTD | -53.05% |
| 2023 | 73.00% |
| 2022 | -53.92% |
| 2021 | -87.27% |
| 2020 | -80.06% |
| 2019 | N/A |
Loading social stream, please wait...