Sonnet BioTherapeutics Holdings, Inc. (SONN): Price and Financial Metrics
GET POWR RATINGS... FREE!
SONN POWR Grades
- SONN scores best on the Sentiment dimension, with a Sentiment rank ahead of 98.96% of US stocks.
- SONN's strongest trending metric is Sentiment; it's been moving up over the last 169 days.
- SONN's current lowest rank is in the Stability metric (where it is better than 2.03% of US stocks).
SONN Stock Summary
- Revenue growth over the past 12 months for Sonnet BioTherapeutics Holdings Inc comes in at -89.2%, a number that bests only 1.11% of the US stocks we're tracking.
- The volatility of Sonnet BioTherapeutics Holdings Inc's share price is greater than that of 97.24% US stocks with at least 200 days of trading history.
- Shareholder yield, a measure of how much is returned to shareholders via dividends and share repurchases, for SONN comes in at -185.2% -- higher than that of only 1.68% of stocks in our set.
- Stocks that are quantitatively similar to SONN, based on their financial statements, market capitalization, and price volatility, are INFI, ZSAN, IPHA, BBI, and DRRX.
- SONN's SEC filings can be seen here. And to visit Sonnet BioTherapeutics Holdings Inc's official web site, go to www.sonnetbio.com.
SONN Valuation Summary
- In comparison to the median Healthcare stock, SONN's EV/EBIT ratio is 101.37% lower, now standing at -0.4.
- Over the past 181 months, SONN's price/sales ratio has gone NA NA.
- Over the past 181 months, SONN's price/earnings ratio has gone up 68.8.
Below are key valuation metrics over time for SONN.
Stock | Date | P/S | P/B | P/E | EV/EBIT |
---|---|---|---|---|---|
SONN | 2021-08-31 | NA | 12.6 | -0.3 | -0.4 |
SONN | 2021-08-30 | NA | 10.2 | -0.2 | -0.3 |
SONN | 2021-08-27 | NA | 10.5 | -0.2 | -0.3 |
SONN | 2021-08-26 | NA | 10.4 | -0.2 | -0.3 |
SONN | 2021-08-25 | NA | 11.0 | -0.2 | -0.4 |
SONN | 2021-08-24 | NA | 11.7 | -0.2 | -0.4 |
SONN Growth Metrics
- Its 3 year net income to common stockholders growth rate is now at 44.67%.
- Its 5 year net income to common stockholders growth rate is now at -58.38%.
- The year over year net cashflow from operations growth rate now stands at -342.62%.

The table below shows SONN's growth in key financial areas (numbers in millions of US dollars).
Date | Revenue | Operating Cash Flow | Net Income to Common Stock |
---|---|---|---|
2021-12-31 | 0.613425 | -25.66291 | -25.3077 |
2021-09-30 | 0.483626 | -22.55224 | -24.98396 |
2021-06-30 | 0 | -22.15688 | -66.89109 |
2021-03-31 | 0 | -23.48151 | -72.5546 |
2020-12-31 | 5.681238 | -19.59896 | -68.46528 |
2020-09-30 | 0 | -15.61478 | -65.60405 |
SONN's Quality Factors
The “Quality” component of the POWR Ratings focuses on 31 different factors of a companies fundamentals and operational strength. Here are some key insights as we drill into the specifics of these quality attributes.- SONN has a Quality Grade of D, ranking ahead of 9.63% of graded US stocks.
- SONN's asset turnover comes in at 0 -- ranking 440th of 681 Pharmaceutical Products stocks.
- QGEN, ALNY, and RDUS are the stocks whose asset turnover ratios are most correlated with SONN.
The table below shows SONN's key quality metrics over time.
Period | Asset Turnover | Gross Margin | ROIC |
---|---|---|---|
2021-06-30 | 0.000 | NA | 6.121 |
2021-03-30 | 0.000 | NA | 8.723 |
2020-12-31 | 0.492 | 0.045 | -7.708 |
2020-09-30 | 0.000 | NA | -2.244 |
2020-06-30 | 0.549 | 0.025 | -1.292 |
2020-03-31 | 0.683 | 0.039 | -0.581 |
SONN Price Target
For more insight on analysts targets of SONN, see our SONN price target page. And for a list of of all stocks sorted by upside potential based on analyst target price, see our Top Price Target page.
Average Price Target | $6.50 | Average Broker Recommendation | 1.25 (Strong Buy) |
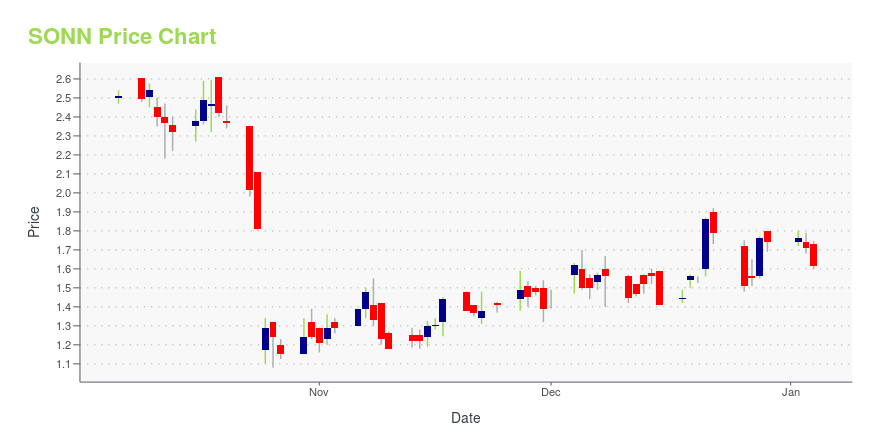
SONN Stock Price Chart Interactive Chart >
SONN Price/Volume Stats
Current price | $0.27 | 52-week high | $2.07 |
Prev. close | $0.26 | 52-week low | $0.24 |
Day low | $0.26 | Volume | 581,600 |
Day high | $0.27 | Avg. volume | 4,745,661 |
50-day MA | $0.33 | Dividend yield | N/A |
200-day MA | $0.47 | Market Cap | 16.07M |
Sonnet BioTherapeutics Holdings, Inc. (SONN) Company Bio
Sonnet BioTherapeutics Holdings, Inc. operates as a clinical stage biotechnology company. The Company develops fully human albumin binding technology that helps the development of innovative targeted biologic drugs with enhanced single-or bi-specific mechanisms. Sonnet BioTherapeutics Holdings serves customers in the United States.
Latest SONN News From Around the Web
Below are the latest news stories about Sonnet BioTherapeutics Holdings Inc that investors may wish to consider to help them evaluate SONN as an investment opportunity.
Analysts Offer Insights on Healthcare Companies: Sonnet BioTherapeutics Holdings (SONN), Armata Pharmaceuticals (ARMP) and Quotient (QTNT)There's a lot to be optimistic about in the Healthcare sector as 3 analysts just weighed in on Sonnet BioTherapeutics Holdings (SONN – Research Report), Armata Pharmaceuticals (ARMP – Research Report) and Quotient (QTNT – Research Report) with bullish sentiments. Sonnet BioTherapeutics Holdings (SONN) BTIG analyst Kaveri Pohlman maintained a Buy rating on Sonnet BioTherapeutics Holdings on February 8 and set a price target of $2.00. The company's shares closed last Wednesday at $0.31, close to its 52-week low of $0.28. According to TipRanks. |
H.C. Wainwright Thinks Sonnet BioTherapeutics Holdings’ Stock is Going to RecoverH.C. Wainwright analyst Michael King reiterated a Buy rating on Sonnet BioTherapeutics Holdings (SONN – Research Report) today and set a price target of $2.00. The company's shares closed last Wednesday at $0.31, close to its 52-week low of $0.28. According to TipRanks.com, King is a 4-star analyst with an average return of 12.4% and a 43.7% success rate. King covers the Healthcare sector, focusing on stocks such as Werewolf Therapeutics, Intellia Therapeutics, and Compass Therapeutics. Sonnet BioTherapeutics Holdings has an analyst consensus of Strong Buy, with a price target consensus of $3.17. See today’s best-performing stocks on TipRanks >> The company has a one-year high of $3. |
Sonnet BioTherapeutics Announces Abstract Accepted for Presentation in a Poster Session at the AACR 2022 Annual MeetingPRINCETON, NJ / ACCESSWIRE / February 9, 2022 / Sonnet BioTherapeutics Holdings, Inc. (NASDAQ:SONN) ("Sonnet" or the "Company"), a biopharmaceutical company developing innovative targeted biologic drugs, announced today that data from preclinical studies of the company's proprietary Fully Human Albumin Binding candidates, SON-1010, SON-1210, and SON-1410, will be presented at the upcoming American Association for Cancer Research (AACR) Annual Meeting 2022, to be held April 8-13, in New Orleans, |
Sonnet BioTherapeutics Provides Fiscal Year 2022 First Quarter Business and Earnings Update* SON-1010 and SON-080 on track to initiate clinical studies during the second quarter of 2022 * Completed R&D manufacturing for SON-1210 non-GLP toxicity study in non-human primates, with study initiation planned for the first half of 2022 * Continue to advance preclinical development of FHAB pipelinePRINCETON, NJ / ACCESSWIRE / February 8, 2022 / Sonnet BioTherapeutics Holdings, Inc. (NASDAQ:SONN) ("Sonnet" or the "Company"), a biopharmaceutical company developing innovative targeted biologic |
BTIG Thinks Sonnet BioTherapeutics Holdings’ Stock is Going to RecoverIn a report issued on December 17, Kaveri Pohlman from BTIG maintained a Buy rating on Sonnet BioTherapeutics Holdings (SONN – Research Report), with a price target of $5.00. The company's shares closed last Friday at $0.47, close to its 52-week low of $0.43. According to TipRanks.com, Pohlman is currently ranked with 0 stars on a 0-5 stars ranking scale, with an average return of -9.2% and a 20.0% success rate. Pohlman covers the Healthcare sector, focusing on stocks such as Checkmate Pharmaceuticals, Mersana Therapeutics, and CytomX Therapeutics. Sonnet BioTherapeutics Holdings has an analyst consensus of Moderate Buy, with a price target consensus of $3.50, which is a 605. |
SONN Price Returns
1-mo | -11.07% |
3-mo | -7.22% |
6-mo | -52.53% |
1-year | -82.58% |
3-year | -99.15% |
5-year | -99.64% |
YTD | -34.64% |
2021 | -81.48% |
2020 | -85.46% |
2019 | -54.26% |
2018 | -50.95% |
2017 | -37.38% |
Loading social stream, please wait...