
Sonos, Inc. (SONO): Price and Financial Metrics
SONO Price/Volume Stats
| Current price | $13.57 | 52-week high | $19.76 |
| Prev. close | $13.58 | 52-week low | $9.78 |
| Day low | $13.35 | Volume | 1,231,570 |
| Day high | $13.82 | Avg. volume | 1,784,457 |
| 50-day MA | $15.14 | Dividend yield | N/A |
| 200-day MA | $15.86 | Market Cap | 1.67B |
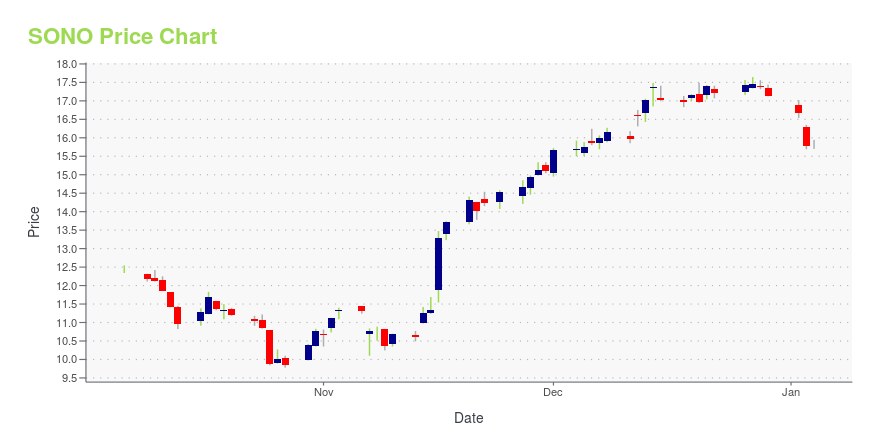
SONO Stock Price Chart Interactive Chart >
Sonos, Inc. (SONO) Company Bio
Sonos, Inc. designs, develops, manufactures, and sells multi-room audio products primarily for use in private residences in the United States and internationally. It offers wireless speakers, home theater speakers, and components. The company offers its products through third-party retail stores and e-commerce retailers, as well as through its sonos.com Website. The company was formerly known as Rincon Audio, Inc. and changed its name to Sonos, Inc. in May 2004. Sonos, Inc. was founded in 2002 and is based in Santa Barbara, California.
Latest SONO News From Around the Web
Below are the latest news stories about SONOS INC that investors may wish to consider to help them evaluate SONO as an investment opportunity.
2 Reasons Why Small-Cap Stocks Could Explode Higher in 2024Knowing the reasons doesn't tell investors which stocks to buy, but it could point them in the right direction. |
Investors in Sonos (NASDAQ:SONO) have seen notable returns of 77% over the past five yearsIf you buy and hold a stock for many years, you'd hope to be making a profit. Furthermore, you'd generally like to see... |
Sonos Stock Belongs On Your Watchlist As RS Rating Jump HigherOver 100 years of market history shows that the top-performing stocks tend to have an 80 or higher RS Rating as they launch their biggest climbs. See if Sonos stock can continue to rebound and clear that threshold. Is Sonos Stock A Buy? |
Why Is Sonos (SONO) Up 30.7% Since Last Earnings Report?Sonos (SONO) reported earnings 30 days ago. What's next for the stock? We take a look at earnings estimates for some clues. |
A Look At The Fair Value Of Sonos, Inc. (NASDAQ:SONO)Key Insights Sonos' estimated fair value is US$18.84 based on 2 Stage Free Cash Flow to Equity Current share price of... |
SONO Price Returns
| 1-mo | -6.41% |
| 3-mo | -20.04% |
| 6-mo | -16.65% |
| 1-year | -20.55% |
| 3-year | -58.41% |
| 5-year | 27.30% |
| YTD | -20.83% |
| 2023 | 1.42% |
| 2022 | -43.29% |
| 2021 | 27.40% |
| 2020 | 49.74% |
| 2019 | 59.06% |
Continue Researching SONO
Want to do more research on Sonos Inc's stock and its price? Try the links below:Sonos Inc (SONO) Stock Price | Nasdaq
Sonos Inc (SONO) Stock Quote, History and News - Yahoo Finance
Sonos Inc (SONO) Stock Price and Basic Information | MarketWatch
Loading social stream, please wait...