Virgin Galactic Holdings Inc. (SPCE): Price and Financial Metrics
GET POWR RATINGS... FREE!
SPCE POWR Grades
- Momentum is the dimension where SPCE ranks best; there it ranks ahead of 52.32% of US stocks.
- SPCE's strongest trending metric is Value; it's been moving down over the last 177 days.
- SPCE's current lowest rank is in the Stability metric (where it is better than 0.28% of US stocks).
SPCE Stock Summary
- VIRGIN GALACTIC HOLDINGS INC's capital turnover -- a measure of revenue relative to shareholder's equity -- is better than merely 7.61% of US listed stocks.
- With a price/sales ratio of 932.53, VIRGIN GALACTIC HOLDINGS INC has a higher such ratio than 99.58% of stocks in our set.
- As for revenue growth, note that SPCE's revenue has grown -49.73% over the past 12 months; that beats the revenue growth of just 3.81% of US companies in our set.
- Stocks that are quantitatively similar to SPCE, based on their financial statements, market capitalization, and price volatility, are LXRX, CDXS, PXLW, MRNS, and TFFP.
- SPCE's SEC filings can be seen here. And to visit VIRGIN GALACTIC HOLDINGS INC's official web site, go to www.virgingalactic.com.
SPCE Valuation Summary
- In comparison to the median Industrials stock, SPCE's EV/EBIT ratio is 119.83% lower, now standing at -3.4.
- Over the past 65 months, SPCE's price/earnings ratio has gone NA NA.
Below are key valuation metrics over time for SPCE.
Stock | Date | P/S | P/B | P/E | EV/EBIT |
---|---|---|---|---|---|
SPCE | 2023-01-24 | 922.2 | 2.4 | -3.4 | -3.4 |
SPCE | 2023-01-23 | 920.4 | 2.4 | -3.4 | -3.4 |
SPCE | 2023-01-20 | 899.6 | 2.3 | -3.3 | -3.3 |
SPCE | 2023-01-19 | 842.4 | 2.2 | -3.1 | -3.1 |
SPCE | 2023-01-18 | 851.1 | 2.2 | -3.1 | -3.2 |
SPCE | 2023-01-17 | 968.9 | 2.5 | -3.6 | -3.6 |
SPCE's Quality Factors
The “Quality” component of the POWR Ratings focuses on 31 different factors of a companies fundamentals and operational strength. Here are some key insights as we drill into the specifics of these quality attributes.- SPCE has a Quality Grade of F, ranking ahead of 4.53% of graded US stocks.
- SPCE's asset turnover comes in at 0.001 -- ranking 135th of 137 Transportation stocks.
- USAK, ASC, and PSHG are the stocks whose asset turnover ratios are most correlated with SPCE.
The table below shows SPCE's key quality metrics over time.
Period | Asset Turnover | Gross Margin | ROIC |
---|---|---|---|
2021-06-30 | 0.001 | 0.890 | -74.990 |
2021-03-31 | 0.000 | NA | -46.550 |
2020-12-31 | 0.000 | 0.273 | -40.205 |
2020-12-31 | 0.000 | 0.273 | -17.021 |
2020-09-30 | 0.006 | 0.458 | -34.498 |
2020-06-30 | 0.007 | 0.458 | -1.870 |
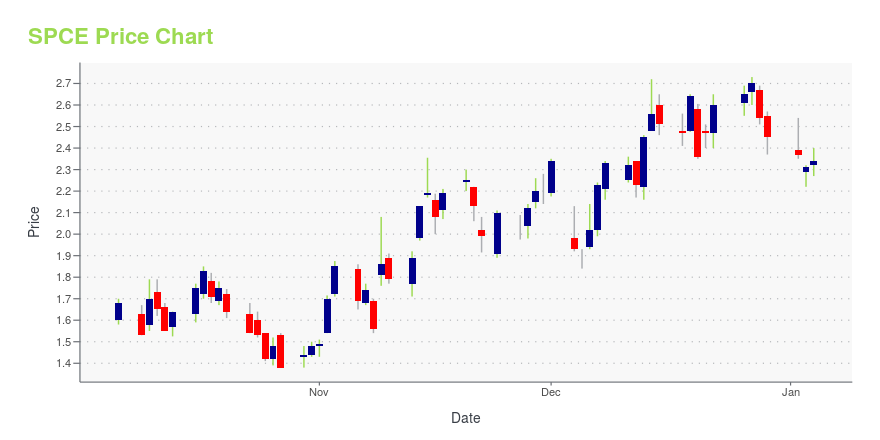
SPCE Stock Price Chart Interactive Chart >
SPCE Price/Volume Stats
Current price | $5.38 | 52-week high | $11.25 |
Prev. close | $5.71 | 52-week low | $3.24 |
Day low | $5.36 | Volume | 7,478,000 |
Day high | $5.71 | Avg. volume | 11,569,742 |
50-day MA | $4.58 | Dividend yield | N/A |
200-day MA | $5.85 | Market Cap | 1.48B |
Virgin Galactic Holdings Inc. (SPCE) Company Bio
Virgin Galactic Holdings, Inc. operates as a holding company, which engages in the business of owning and operating privately built spaceships. It designs spaceships which can fly anyone to space safely without the need for expertise or exhaustive time consuming training. The company develops passenger carrying manned spacecraft. The company was founded on May 5, 2017 and is headquartered in Las Cruces, NM
Latest SPCE News From Around the Web
Below are the latest news stories about VIRGIN GALACTIC HOLDINGS INC that investors may wish to consider to help them evaluate SPCE as an investment opportunity.
Imagine The Shock Of Waking Up To Elon Musk''s Barefoot In Your Kitchen, It Happened To This BillionaireThe night before a major event for a company he founded, billionaire Richard Branson was woken up by Elon Musk . Here’s the strange but true story. What Happened: In July 2021, Richard Branson went to space at the age of 71, hitting the milestone aboard a spacecraft from Virgin Galactic (NYSE: SPCE ). The flight beat fellow billionaire Jeff Bezos to space in a race between their respective space companies. The night before his space flight, Branson abruptly woke up to the sight of Musk''s barefoot in his kitchen at 2:30 a.m. local time at his New Mexico home. A member of Branson’s family let Musk enter the home. “Elon had decided to surprise us,” Branson said , recalling the visit to The Sunday Times magazine. “He was there with his baby. Basically, he’s a night animal.” Musk came to gi... |
Does Virgin Galactic''s Management Shake-up Signal a Buying Opportunity?Less than 160 days from now, Virgin Galactic will launch its first load of paying tourists to space -- maybe. |
Does Virgin Galactic's Management Shake-up Signal a Buying Opportunity?Less than 160 days from now, Virgin Galactic will launch its first load of paying tourists to space -- maybe. |
Feel free to follow this:: AGNC Investment Corp. (NASDAQ:AGNC -0.69%), Virgin Galactic Holdings, Inc. (NYSE:SPCE 2.35%)AGNC has seen its SMA50 which is now 12.46%. In looking the SMA 200 we see that the stock has seen a 5.07%. SPCE has seen its SMA50 which is … The post Feel free to follow this:: AGNC Investment Corp. (NASDAQ:AGNC -0.69%), Virgin Galactic Holdings, Inc. (NYSE:SPCE 2.35%) appeared first on Stocks Equity . |
Wondrous stocks: Paramount Global (NASDAQ:PARA 3.73%), Virgin Galactic Holdings, Inc. (NYSE:SPCE 6.79%)There are two main reasons why moving averages are useful in forex trading: moving averages help traders define trend recognize changes in trend. Now well have a look on, SMA50 … The post Wondrous stocks: Paramount Global (NASDAQ:PARA 3.73%), Virgin Galactic Holdings, Inc. (NYSE:SPCE 6.79%) appeared first on Stocks Equity . |
SPCE Price Returns
1-mo | 54.60% |
3-mo | 18.76% |
6-mo | -34.31% |
1-year | -41.52% |
3-year | -68.63% |
5-year | N/A |
YTD | 54.60% |
2022 | -73.99% |
2021 | -43.62% |
2020 | 105.45% |
2019 | N/A |
2018 | N/A |
Loading social stream, please wait...