
South Plains Financial, Inc. (SPFI): Price and Financial Metrics
SPFI Price/Volume Stats
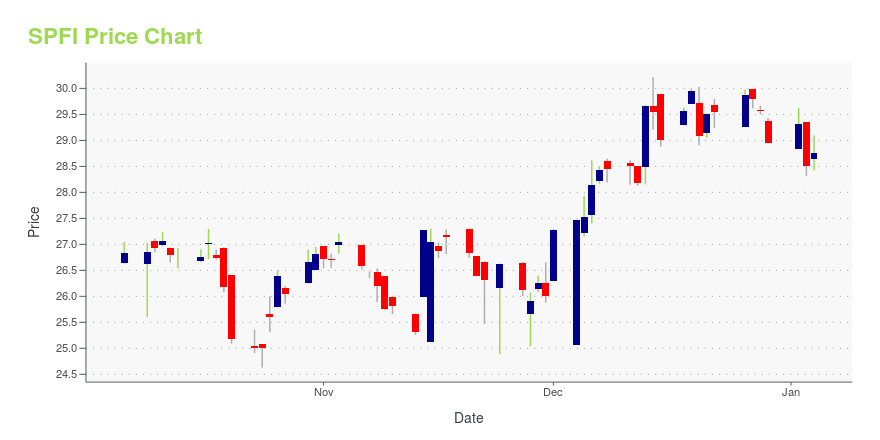
| Current price | $33.08 | 52-week high | $33.85 |
| Prev. close | $33.05 | 52-week low | $23.75 |
| Day low | $32.85 | Volume | 26,876 |
| Day high | $33.84 | Avg. volume | 32,541 |
| 50-day MA | $27.81 | Dividend yield | 1.66% |
| 200-day MA | $27.07 | Market Cap | 543.14M |
SPFI Stock Price Chart Interactive Chart >
South Plains Financial, Inc. (SPFI) Company Bio
South Plains Financial, Inc. is a bank holding company, which engages in the provision of commercial and retail banking services through its subsidiary, City Bank. The firm also offers insurance, investment, trust, and mortgage services though its other non-bank subsidiaries. It operates through the Banking and Insurance business segments. The company was founded on October 28, 1992 and is headquartered in Lubbock, TX.
Latest SPFI News From Around the Web
Below are the latest news stories about SOUTH PLAINS FINANCIAL INC that investors may wish to consider to help them evaluate SPFI as an investment opportunity.
Are Investors Undervaluing South Plains Financial (SPFI) Right Now?Here at Zacks, our focus is on the proven Zacks Rank system, which emphasizes earnings estimates and estimate revisions to find great stocks. Nevertheless, we are always paying attention to the latest value, growth, and momentum trends to underscore strong picks. |
Strength Seen in Cadence (CADE): Can Its 6.0% Jump Turn into More Strength?Cadence (CADE) saw its shares surge in the last session with trading volume being higher than average. The latest trend in earnings estimate revisions may not translate into further price increase in the near term. |
Is South Plains Financial (SPFI) Stock Undervalued Right Now?Here at Zacks, our focus is on the proven Zacks Rank system, which emphasizes earnings estimates and estimate revisions to find great stocks. Nevertheless, we are always paying attention to the latest value, growth, and momentum trends to underscore strong picks. |
What Makes South Plains Financial (SPFI) a New Buy StockSouth Plains Financial (SPFI) might move higher on growing optimism about its earnings prospects, which is reflected by its upgrade to a Zacks Rank #2 (Buy). |
South Plains Financial Inc's Dividend AnalysisAs investors look forward to this upcoming payment, the spotlight also shines on the company's dividend history, yield, and growth rates. Using the data from GuruFocus, let's delve into South Plains Financial Inc's dividend performance and assess its sustainability. What Does South Plains Financial Inc Do? |
SPFI Price Returns
| 1-mo | 26.60% |
| 3-mo | 27.57% |
| 6-mo | 16.69% |
| 1-year | 28.73% |
| 3-year | 49.47% |
| 5-year | 101.42% |
| YTD | 15.36% |
| 2023 | 7.42% |
| 2022 | 0.68% |
| 2021 | 48.66% |
| 2020 | -8.31% |
| 2019 | N/A |
SPFI Dividends
| Ex-Dividend Date | Type | Payout Amount | Change | ||||||
|---|---|---|---|---|---|---|---|---|---|
| Loading, please wait... | |||||||||
Loading social stream, please wait...