Block Inc. (SQ): Price and Financial Metrics
GET POWR RATINGS... FREE!
SQ POWR Grades
- SQ scores best on the Growth dimension, with a Growth rank ahead of 85.68% of US stocks.
- The strongest trend for SQ is in Value, which has been heading up over the past 179 days.
- SQ's current lowest rank is in the Stability metric (where it is better than 2.16% of US stocks).
SQ Stock Summary
- Block Inc's market capitalization of $85,175,724,356 is ahead of 96.86% of US-listed equities.
- SQ's current price/earnings ratio is 512.23, which is higher than 98.57% of US stocks with positive earnings.
- The price/operating cash flow metric for Block Inc is higher than 95.56% of stocks in our set with a positive cash flow.
- Stocks that are quantitatively similar to SQ, based on their financial statements, market capitalization, and price volatility, are SHOP, VMW, ATVI, NET, and INTU.
- Visit SQ's SEC page to see the company's official filings. To visit the company's web site, go to www.squareup.com.
SQ Valuation Summary
- In comparison to the median Technology stock, SQ's price/earnings ratio is 451.28% higher, now standing at 215.
- Over the past 70 months, SQ's EV/EBIT ratio has gone up 232.4.
- SQ's price/sales ratio has moved up 3.6 over the prior 70 months.
Below are key valuation metrics over time for SQ.
Stock | Date | P/S | P/B | P/E | EV/EBIT |
---|---|---|---|---|---|
SQ | 2021-09-01 | 7.7 | 45.9 | 215.0 | 205.4 |
SQ | 2021-08-31 | 7.7 | 45.8 | 214.9 | 205.3 |
SQ | 2021-08-30 | 7.8 | 46.5 | 218.0 | 208.2 |
SQ | 2021-08-27 | 7.7 | 45.8 | 214.8 | 205.2 |
SQ | 2021-08-26 | 7.6 | 44.8 | 210.1 | 200.8 |
SQ | 2021-08-25 | 7.7 | 45.7 | 214.5 | 204.9 |
SQ's Quality Factors
The “Quality” component of the POWR Ratings focuses on 31 different factors of a companies fundamentals and operational strength. Here are some key insights as we drill into the specifics of these quality attributes.- SQ has a Quality Grade of D, ranking ahead of 13.6% of graded US stocks.
- SQ's asset turnover comes in at 1.368 -- ranking 63rd of 563 Business Services stocks.
- CAI, TRIP, and TRUE are the stocks whose asset turnover ratios are most correlated with SQ.
The table below shows SQ's key quality metrics over time.
Period | Asset Turnover | Gross Margin | ROIC |
---|---|---|---|
2021-09-30 | 1.368 | 0.241 | 0.076 |
2021-06-30 | 1.477 | 0.232 | 0.095 |
2021-03-31 | 1.419 | 0.240 | 0.078 |
2020-12-31 | 1.195 | 0.288 | 0.060 |
2020-09-30 | 1.156 | 0.321 | 0.093 |
2020-06-30 | 1.052 | 0.367 | 0.103 |
SQ Price Target
For more insight on analysts targets of SQ, see our SQ price target page. And for a list of of all stocks sorted by upside potential based on analyst target price, see our Top Price Target page.
Average Price Target | $303.17 | Average Broker Recommendation | 1.58 (Moderate Buy) |
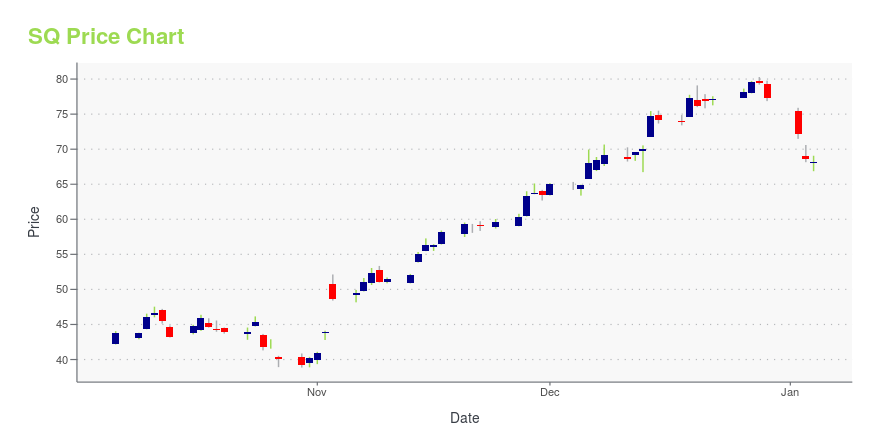
SQ Stock Price Chart Interactive Chart >
SQ Price/Volume Stats
Current price | $83.40 | 52-week high | $289.23 |
Prev. close | $83.44 | 52-week low | $65.10 |
Day low | $79.05 | Volume | 19,684,100 |
Day high | $84.15 | Avg. volume | 20,543,490 |
50-day MA | $111.90 | Dividend yield | N/A |
200-day MA | $175.19 | Market Cap | 48.38B |
Block Inc. (SQ) Company Bio
Square Inc. is a software company offering solutions ranging from payments and point-of-sale services to financial and marketing services. It offers a free software app with its hardware to turn mobile devices into POS solutions in minutes. Square’s reader helps sellers accept chip cards and NFC payments and tools, such as the company’s Cash App, helps customers send money to family and friends instantly. Jack Dorsey is CEO and Chairman of Square which was founded in 2009 and is headquartered in San Francisco, California with over 5,400 employees.
Latest SQ News From Around the Web
Below are the latest news stories about Block Inc that investors may wish to consider to help them evaluate SQ as an investment opportunity.
Block By Jack Dorsey Announces 47% Increase In Profits In Q4 Of 2021Block by Jack Dorsey announced 47% increase in profits in the last quarter of 2021 which reached $1.18 billion as we can see further in today’s bitcoin news. Block by Jack Dorsey formerly known as Square, disclosed its gross profits for the last quarter of 2021 and stood at $1.18 billion which is an increase […] |
Jack Dorsey''s Block Announced 47% Increase in Gross Profit in Q4 2021 - BitcoinEthereumNews.comJack Dorsey’s fintech startup Block (formerly known as Square) disclosed its gross profit for Q4 2021 stood at $1.18 billion, which is an increase of 47% |
PayPal: Deep Value FintechThis is my second company deep dive. I have been digging deep in the fintech industry lately as I believe it is one of the most exciting battlegrounds for the next few decades, and PayPal is a must-read for fintech investors, given that it pioneered online payments more than 20... |
5 Block Analysts Praise Q4 Earnings Beat, Cash App OutlookBlock Inc (NYSE: SQ ) shares traded higher by 23% on Friday after the company exceeded expectations with its fourth-quarter earnings report. On Thursday afternoon, Block reported fourth-quarter adjusted EPS of $1.71, beating consensus analyst estimates of $1.66. Fourth-quarter revenue was $4.1 billion, in-line with analyst expectations. Revenue was up 29.1% from a year ago. The company ended the year with 44 million monthly average users and 13 million monthly active debit card users, up 20% from a year ago. Cash App generated $1.96 billion in Bitcoin (CRYPTO: BTC ) in the quarter, up 12% year-over-year. The company also reported holding $371 million in Bitcoin on its balance sheet. Looking ahead, Block guided for Square gross payment volume growth of 35% in the months of January and Fe... |
Q4 2021 Earnings Strong for Coinbase and Block, but not RobinhoodBoth companies beat expectations in Q4 2021 showing strong performance in the quarter, unlike the largest retail trading platform. The post Q4 2021 Earnings Strong for Coinbase and Block, but not Robinhood appeared first on The Tokenist. |
SQ Price Returns
1-mo | -18.77% |
3-mo | -11.19% |
6-mo | -61.33% |
1-year | -58.30% |
3-year | 28.98% |
5-year | 280.47% |
YTD | -48.36% |
2021 | -25.79% |
2020 | 247.89% |
2019 | 11.54% |
2018 | 61.78% |
2017 | 154.37% |
Continue Researching SQ
Want to do more research on Square Inc's stock and its price? Try the links below:Square Inc (SQ) Stock Price | Nasdaq
Square Inc (SQ) Stock Quote, History and News - Yahoo Finance
Square Inc (SQ) Stock Price and Basic Information | MarketWatch
Loading social stream, please wait...