Surmodics, Inc. (SRDX): Price and Financial Metrics
GET POWR RATINGS... FREE!
SRDX POWR Grades
- SRDX scores best on the Sentiment dimension, with a Sentiment rank ahead of 87.54% of US stocks.
- The strongest trend for SRDX is in Quality, which has been heading down over the past 179 days.
- SRDX ranks lowest in Growth; there it ranks in the 1st percentile.
SRDX Stock Summary
- With a price/earnings ratio of 358.98, Surmodics Inc P/E ratio is greater than that of about 98.28% of stocks in our set with positive earnings.
- Price to trailing twelve month operating cash flow for SRDX is currently 48.28, higher than 89.24% of US stocks with positive operating cash flow.
- Over the past twelve months, SRDX has reported earnings growth of -354.41%, putting it ahead of merely 5.55% of US stocks in our set.
- Stocks that are quantitatively similar to SRDX, based on their financial statements, market capitalization, and price volatility, are ARDX, SMCI, CLVS, FBIO, and TVTX.
- Visit SRDX's SEC page to see the company's official filings. To visit the company's web site, go to www.surmodics.com.
SRDX Valuation Summary
- In comparison to the median Healthcare stock, SRDX's price/earnings ratio is 1344.93% higher, now standing at 527.4.
- SRDX's price/sales ratio has moved down 31.7 over the prior 243 months.
Below are key valuation metrics over time for SRDX.
Stock | Date | P/S | P/B | P/E | EV/EBIT |
---|---|---|---|---|---|
SRDX | 2021-08-31 | 8.0 | 5.9 | 527.4 | 152.9 |
SRDX | 2021-08-30 | 7.6 | 5.6 | 498.2 | 143.8 |
SRDX | 2021-08-27 | 7.6 | 5.6 | 495.9 | 143.1 |
SRDX | 2021-08-26 | 7.3 | 5.4 | 478.0 | 137.4 |
SRDX | 2021-08-25 | 7.3 | 5.4 | 478.6 | 137.6 |
SRDX | 2021-08-24 | 7.5 | 5.5 | 492.9 | 142.1 |
SRDX Growth Metrics
- The 5 year revenue growth rate now stands at 51.24%.
- Its 4 year net income to common stockholders growth rate is now at -23.08%.
- The 3 year net income to common stockholders growth rate now stands at -121.62%.

The table below shows SRDX's growth in key financial areas (numbers in millions of US dollars).
Date | Revenue | Operating Cash Flow | Net Income to Common Stock |
---|---|---|---|
2021-12-31 | 105.842 | 12.633 | 1.699 |
2021-09-30 | 105.136 | 15.389 | 4.237 |
2021-06-30 | 103.708 | 15.814 | 1.58 |
2021-03-31 | 106.718 | 24.498 | 7.326 |
2020-12-31 | 94.545 | 10.649 | 0.701 |
2020-09-30 | 94.864 | 14.01 | 1.123 |
SRDX's Quality Factors
The “Quality” component of the POWR Ratings focuses on 31 different factors of a companies fundamentals and operational strength. Here are some key insights as we drill into the specifics of these quality attributes.- SRDX has a Quality Grade of B, ranking ahead of 94.57% of graded US stocks.
- SRDX's asset turnover comes in at 0.604 -- ranking 71st of 186 Medical Equipment stocks.
- MMSI, POAI, and OSUR are the stocks whose asset turnover ratios are most correlated with SRDX.
The table below shows SRDX's key quality metrics over time.
Period | Asset Turnover | Gross Margin | ROIC |
---|---|---|---|
2021-06-30 | 0.604 | 0.837 | 0.071 |
2021-03-31 | 0.632 | 0.848 | 0.115 |
2020-12-31 | 0.578 | 0.832 | -0.017 |
2020-09-30 | 0.588 | 0.839 | -0.016 |
2020-06-30 | 0.648 | 0.854 | 0.060 |
2020-03-31 | 0.648 | 0.861 | 0.063 |
SRDX Price Target
For more insight on analysts targets of SRDX, see our SRDX price target page. And for a list of of all stocks sorted by upside potential based on analyst target price, see our Top Price Target page.
Average Price Target | $76.25 | Average Broker Recommendation | 1.25 (Strong Buy) |
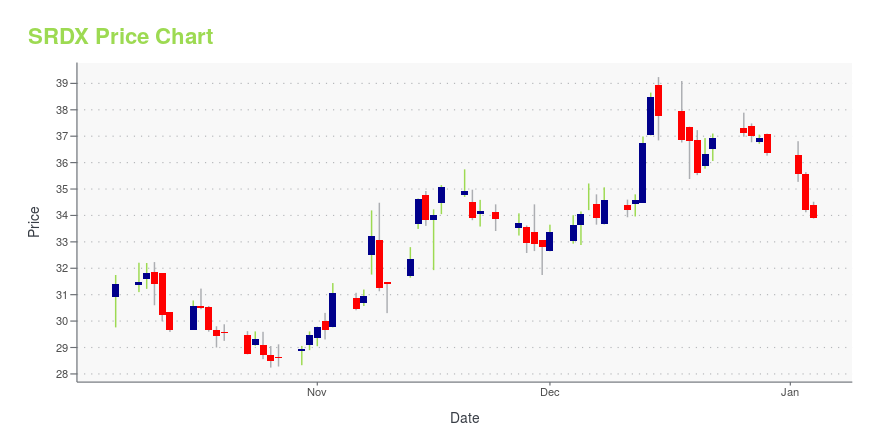
SRDX Stock Price Chart Interactive Chart >
SRDX Price/Volume Stats
Current price | $37.70 | 52-week high | $62.27 |
Prev. close | $37.19 | 52-week low | $32.43 |
Day low | $37.05 | Volume | 6,369 |
Day high | $38.84 | Avg. volume | 43,105 |
50-day MA | $36.65 | Dividend yield | N/A |
200-day MA | $42.20 | Market Cap | 527.42M |
Surmodics, Inc. (SRDX) Company Bio
SurModics Inc. provides surface modification and in vitro diagnostic technologies to the healthcare industry. The company operates through two segments, Medical Device and In Vitro Diagnostics. The company was founded in 1979 and is based in Eden Prairie, Minnesota.
Latest SRDX News From Around the Web
Below are the latest news stories about Surmodics Inc that investors may wish to consider to help them evaluate SRDX as an investment opportunity.
Barrington Sticks to Their Buy Rating for SurModics (SRDX)Barrington analyst Michael Petusky reiterated a Buy rating on SurModics (SRDX – Research Report) today and set a price target of $70.00. The company's shares closed last Thursday at $40.68. According to TipRanks.com, Petusky is a 4-star analyst with an average return of 7.7% and a 47.9% success rate. Petusky covers the Healthcare sector, focusing on stocks such as ATI Physical Therapy, US Physical Therapy, and Anika Therapeutics. Currently, the analyst consensus on SurModics is a Moderate Buy with an average price target of $64.00, representing a 76.6% upside. In a report released yesterday, Needham also maintained a Buy rating on the stock with a $58.00 price target. |
Surmodics to Host Virtual Annual Meeting of ShareholdersEDEN PRAIRIE, Minn., February 04, 2022--Surmodics to Host Virtual Annual Meeting of Shareholders on February 10, 2022 at 4:00 p.m. (CT) |
Increases to Surmodics, Inc.'s (NASDAQ:SRDX) CEO Compensation Might Cool off for nowIn the past three years, the share price of Surmodics, Inc. ( NASDAQ:SRDX ) has struggled to grow and now shareholders... |
Surmodics Non-GAAP EPS of -$0.13, revenue of $23M; reaffirms full year guidanceSurmodics press release (SRDX): FQ1 Non-GAAP EPS of -$0.13.Revenue of $23M (+3.1% Y/Y).Surmodics expects fiscal year 2022 revenue to range from $97 million to $101 million vs |
SurModics (SRDX) Reports Q1 Loss, Misses Revenue EstimatesSurModics (SRDX) delivered earnings and revenue surprises of 63.89% and 3.47%, respectively, for the quarter ended December 2021. Do the numbers hold clues to what lies ahead for the stock? |
SRDX Price Returns
1-mo | 9.47% |
3-mo | 4.98% |
6-mo | -9.53% |
1-year | -29.59% |
3-year | -14.01% |
5-year | 53.25% |
YTD | -21.70% |
2021 | 10.64% |
2020 | 5.04% |
2019 | -12.34% |
2018 | 68.79% |
2017 | 10.24% |
Continue Researching SRDX
Here are a few links from around the web to help you further your research on Surmodics Inc's stock as an investment opportunity:Surmodics Inc (SRDX) Stock Price | Nasdaq
Surmodics Inc (SRDX) Stock Quote, History and News - Yahoo Finance
Surmodics Inc (SRDX) Stock Price and Basic Information | MarketWatch
Loading social stream, please wait...