SSR Mining Inc. (SSRM): Price and Financial Metrics
GET POWR RATINGS... FREE!
SSRM POWR Grades
- SSRM scores best on the Quality dimension, with a Quality rank ahead of 61.6% of US stocks.
- SSRM's strongest trending metric is Growth; it's been moving down over the last 179 days.
- SSRM ranks lowest in Growth; there it ranks in the 19th percentile.
SSRM Stock Summary
- Of note is the ratio of Ssr Mining Inc's sales and general administrative expense to its total operating expenses; merely 9.9% of US stocks have a lower such ratio.
- With a year-over-year growth in debt of 130.72%, Ssr Mining Inc's debt growth rate surpasses 92.06% of about US stocks.
- Revenue growth over the past 12 months for Ssr Mining Inc comes in at 73.75%, a number that bests 88.4% of the US stocks we're tracking.
- If you're looking for stocks that are quantitatively similar to Ssr Mining Inc, a group of peers worth examining would be RPRX, GFI, CNHI, KGC, and PCAR.
- SSRM's SEC filings can be seen here. And to visit Ssr Mining Inc's official web site, go to www.ssrmining.com.
SSRM Valuation Summary
- In comparison to the median Basic Materials stock, SSRM's price/earnings ratio is 39.2% higher, now standing at 27.7.
- SSRM's price/sales ratio has moved NA NA over the prior 240 months.
- SSRM's EV/EBIT ratio has moved up 45.1 over the prior 240 months.
Below are key valuation metrics over time for SSRM.
Stock | Date | P/S | P/B | P/E | EV/EBIT |
---|---|---|---|---|---|
SSRM | 2021-09-03 | 4.3 | 1.1 | 27.7 | 16.4 |
SSRM | 2021-09-02 | 4.3 | 1.1 | 27.2 | 16.1 |
SSRM | 2021-09-01 | 4.2 | 1.1 | 27.1 | 16.0 |
SSRM | 2021-08-31 | 4.3 | 1.1 | 27.5 | 16.3 |
SSRM | 2021-08-30 | 4.2 | 1.0 | 26.8 | 15.9 |
SSRM | 2021-08-27 | 4.3 | 1.1 | 27.3 | 16.2 |
SSRM Growth Metrics
- Its 5 year price growth rate is now at 30.93%.
- The 2 year net cashflow from operations growth rate now stands at 483.27%.
- Its 3 year net cashflow from operations growth rate is now at -21.38%.

The table below shows SSRM's growth in key financial areas (numbers in millions of US dollars).
Date | Revenue | Operating Cash Flow | Net Income to Common Stock |
---|---|---|---|
2020-12-31 | 853.089 | 348.615 | 133.494 |
2019-12-31 | 606.85 | 134.198 | 57.315 |
2018-12-31 | 420.675 | 59.769 | 6.379 |
2017-12-31 | 448.773 | 144.725 | 69.316 |
2016-12-31 | 490.986 | 170.684 | 64.957 |
SSRM's Quality Factors
The “Quality” component of the POWR Ratings focuses on 31 different factors of a companies fundamentals and operational strength. Here are some key insights as we drill into the specifics of these quality attributes.- SSRM has a Quality Grade of C, ranking ahead of 73.49% of graded US stocks.
- SSRM's asset turnover comes in at 0.244 -- ranking 81st of 444 Trading stocks.
- 500 - Internal server error
The table below shows SSRM's key quality metrics over time.
Period | Asset Turnover | Gross Margin | ROIC |
---|---|---|---|
2020-12-31 | 0.244 | 0.362 | 0.069 |
2019-12-31 | 0.371 | 0.282 | 0.097 |
2018-12-31 | 0.275 | 0.183 | 0.040 |
2017-12-31 | 0.302 | 0.252 | 0.092 |
2016-12-31 | 0.425 | 0.314 | 0.114 |
2015-12-31 | 0.404 | 0.050 | -0.108 |
SSRM Price Target
For more insight on analysts targets of SSRM, see our SSRM price target page. And for a list of of all stocks sorted by upside potential based on analyst target price, see our Top Price Target page.
Average Price Target | $26.94 | Average Broker Recommendation | 1.5 (Moderate Buy) |
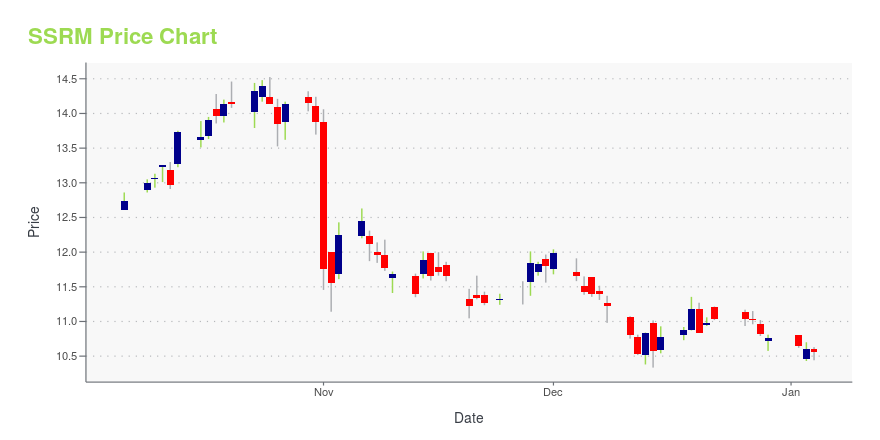
SSRM Stock Price Chart Interactive Chart >
SSRM Price/Volume Stats
Current price | $19.99 | 52-week high | $24.58 |
Prev. close | $20.54 | 52-week low | $14.19 |
Day low | $19.83 | Volume | 1,660,300 |
Day high | $20.37 | Avg. volume | 1,985,421 |
50-day MA | $21.58 | Dividend yield | 1.4% |
200-day MA | $18.24 | Market Cap | 4.25B |
SSR Mining Inc. (SSRM) Company Bio
SSR Mining, formerly known as Silver Standard Resources Corporation, engages in the acquisition, exploration, development, and operation of precious metal mineral properties in Argentina and Nevada. The company was founded in 1946 and is based in Vancouver, Canada.
Latest SSRM News From Around the Web
Below are the latest news stories about Ssr Mining Inc that investors may wish to consider to help them evaluate SSRM as an investment opportunity.
Dow Jones Trades Off Lows, Nasdaq Reverses Higher; Financial Stocks UnderperformThe Dow Jones Industrial Average held near lows on Thursday while the Nasdaq pared earlier losses and briefly traded positive. |
SSR Mining Stock Clears Technical Benchmark, Hitting 90-Plus RS RatingOn Thursday, SSR Mining cleared an important technical benchmark, with its Relative Strength (RS) Rating jumping into the 90-plus percentile with an improvement to 93, an increase from 83 the day before. When looking for the best stocks to buy and watch, one factor to watch closely is relative price strength. Over 100 years of market history reveals that the market's biggest winners tend to have an RS Rating north of 80 in the early stages of their moves. |
Precious metals company SSR Mining soars 9% after solid beat: Q4 EarningsSSR Mining (NASDAQ:SSRM) is up 9% after the company reported easy beat on both lines in its fourth quarter's earnings results. Revenue of $407.92M (+10.0% Y/Y) beats consensus by $18.44M. The company has delivered fourth quarter production of 211,717 gold equivalent ounces at AISC of $961/oz. Gross margin was 38% vs. 41% a year... |
Stock Market Closes Down For Fourth Day In A Row As Ukraine Tensions EscalateFor the fourth day in a row, the stock market closed lower, falling deeper into a slump. Tech stocks led the downside as investors remained on edge over the potential war in Ukraine. Some investors moved into gold stocks as a safe haven. |
Why SSR Mining Stock Popped TodayShares of gold miner SSR Mining (NASDAQ: SSRM) had jumped 9.7% at 2:45 p.m. ET on Wednesday after the company announced this morning that it had met consensus targets for its fourth-quarter earnings and beat expectations on sales quite soundly. Heading into the quarter, analysts had forecast that SSR would earn $0.46 per share (adjusted) on sales of $382 million in the fourth quarter. |
SSRM Price Returns
1-mo | -5.41% |
3-mo | 1.87% |
6-mo | 11.28% |
1-year | 10.27% |
3-year | 84.39% |
5-year | 108.51% |
YTD | 13.73% |
2021 | -11.48% |
2020 | 4.41% |
2019 | 59.31% |
2018 | 37.54% |
2017 | -1.46% |
SSRM Dividends
Ex-Dividend Date | Type | Payout Amount | Change | ||||||
---|---|---|---|---|---|---|---|---|---|
Loading, please wait... |
Continue Researching SSRM
Here are a few links from around the web to help you further your research on Ssr Mining Inc's stock as an investment opportunity:Ssr Mining Inc (SSRM) Stock Price | Nasdaq
Ssr Mining Inc (SSRM) Stock Quote, History and News - Yahoo Finance
Ssr Mining Inc (SSRM) Stock Price and Basic Information | MarketWatch
Loading social stream, please wait...