SuRo Capital Corp. (SSSS): Price and Financial Metrics
SSSS Price/Volume Stats
Current price | $4.67 | 52-week high | $4.72 |
Prev. close | $4.72 | 52-week low | $3.10 |
Day low | $4.53 | Volume | 50,725 |
Day high | $4.72 | Avg. volume | 101,764 |
50-day MA | $4.11 | Dividend yield | N/A |
200-day MA | $3.89 | Market Cap | 118.40M |
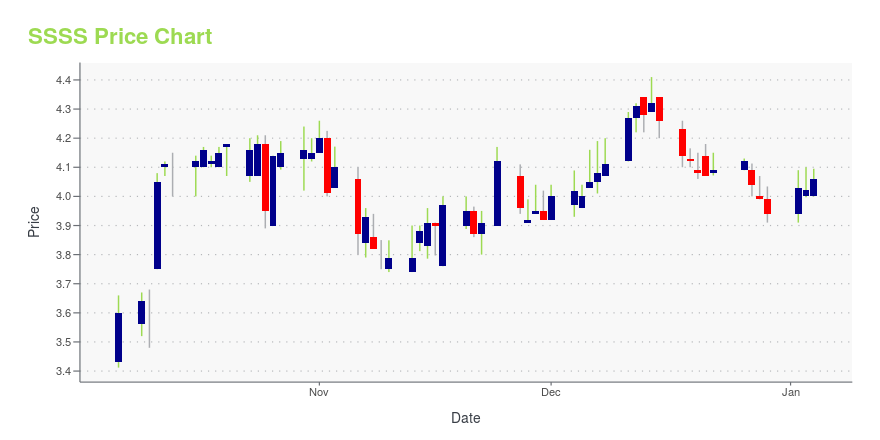
SSSS Stock Price Chart Interactive Chart >
SSSS POWR Grades
- SSSS scores best on the Sentiment dimension, with a Sentiment rank ahead of 99.81% of US stocks.
- The strongest trend for SSSS is in Growth, which has been heading up over the past 26 weeks.
- SSSS ranks lowest in Value; there it ranks in the 30th percentile.
SSSS Stock Summary
- The price/operating cash flow metric for SURO CAPITAL CORP is higher than only 6.1% of stocks in our set with a positive cash flow.
- SSSS's price/sales ratio is 18.11; that's higher than the P/S ratio of 93.87% of US stocks.
- As for revenue growth, note that SSSS's revenue has grown 135.89% over the past 12 months; that beats the revenue growth of 96.4% of US companies in our set.
- If you're looking for stocks that are quantitatively similar to SURO CAPITAL CORP, a group of peers worth examining would be DCO, USPH, TASK, EXLS, and HURN.
- Visit SSSS's SEC page to see the company's official filings. To visit the company's web site, go to www.gsvcap.com.
SSSS Valuation Summary
- SSSS's price/sales ratio is 18.4; this is 1433.33% higher than that of the median Financial Services stock.
- SSSS's price/sales ratio has moved NA NA over the prior 154 months.
Below are key valuation metrics over time for SSSS.
Stock | Date | P/S | P/B | P/E | EV/EBIT |
---|---|---|---|---|---|
SSSS | 2023-12-22 | 18.4 | 0.5 | 57.3 | 14.2 |
SSSS | 2023-12-21 | 18.3 | 0.5 | 57.1 | 14.1 |
SSSS | 2023-12-20 | 18.4 | 0.5 | 57.2 | 14.2 |
SSSS | 2023-12-19 | 18.6 | 0.5 | 57.8 | 14.3 |
SSSS | 2023-12-18 | 18.6 | 0.5 | 58.1 | 14.4 |
SSSS | 2023-12-15 | 19.2 | 0.5 | 59.7 | 14.8 |
SSSS Growth Metrics
- The 3 year price growth rate now stands at 15.57%.
- Its 2 year price growth rate is now at 32.9%.
- Its 4 year net income to common stockholders growth rate is now at 63.47%.
The table below shows SSSS's growth in key financial areas (numbers in millions of US dollars).
Date | Revenue | Operating Cash Flow | Net Income to Common Stock |
---|---|---|---|
2022-09-30 | 2.940168 | -65.17986 | 12.03783 |
2022-06-30 | 2.669753 | 42.79827 | 39.83142 |
2022-03-31 | 1.76259 | 52.70522 | 59.52581 |
2021-12-31 | 1.470842 | 183.6503 | 147.0717 |
2021-09-30 | 1.446659 | 136.0442 | 76.52733 |
2021-06-30 | 1.60567 | 118.4244 | 110.5559 |
SSSS's Quality Factors
The “Quality” component of the POWR Ratings focuses on 31 different factors of a companies fundamentals and operational strength. Here are some key insights as we drill into the specifics of these quality attributes.- SSSS has a Quality Grade of C, ranking ahead of 50.46% of graded US stocks.
- SSSS's asset turnover comes in at 0.004 -- ranking 342nd of 444 Trading stocks.
- BCSF, COR, and LAZ are the stocks whose asset turnover ratios are most correlated with SSSS.
The table below shows SSSS's key quality metrics over time.
Period | Asset Turnover | Gross Margin | ROIC |
---|---|---|---|
2021-06-30 | 0.004 | 1 | 0.304 |
2021-03-31 | 0.004 | 1 | 0.559 |
2020-12-31 | 0.005 | 1 | 0.211 |
2020-09-30 | 0.004 | 1 | 0.058 |
2020-06-30 | 0.004 | 1 | 0.027 |
2020-03-31 | 0.005 | 1 | -0.054 |
SSSS Price Target
For more insight on analysts targets of SSSS, see our SSSS price target page. And for a list of of all stocks sorted by upside potential based on analyst target price, see our Top Price Target page.
Average Price Target | $18.13 | Average Broker Recommendation | 1.12 (Strong Buy) |
SuRo Capital Corp. (SSSS) Company Bio
SuRo Capital Corp. operates as a venture capital investment company. The Company focuses on late-stage institutionally backed private companies. SuRo Capital serves customers in the United States.
Latest SSSS News From Around the Web
Below are the latest news stories about SURO CAPITAL CORP that investors may wish to consider to help them evaluate SSSS as an investment opportunity.
Insider Buying: SuRo Capital Corp's Mark Klein Acquires 49,885 SharesInsider buying is often regarded as a bullish signal for a company's stock, as it suggests that insiders are confident in the future prospects of the business. |
Shareholders in SuRo Capital (NASDAQ:SSSS) are in the red if they invested three years agoIn order to justify the effort of selecting individual stocks, it's worth striving to beat the returns from a market... |
SuRo Capital Corp. (NASDAQ:SSSS) Q3 2023 Earnings Call TranscriptSuRo Capital Corp. (NASDAQ:SSSS) Q3 2023 Earnings Call Transcript November 8, 2023 Operator: Good day, and welcome to the SuRo Capital’s Third Quarter 2023 Earnings Conference Call. Today’s call is being recorded. Your lines will be on listen-only. However, you will have the opportunity to ask questions at the end. [Operator Instructions] I will now […] |
SuRo Capital Corp. Reports Notable Increase in Net Asset Value for Q3 2023Net Asset Value Rises to $8.41 Per Share Amid Market Volatility |
SuRo Capital Corp. Reports Third Quarter 2023 Financial ResultsNet Asset Value of $8.41 Per Share as of September 30, 2023NEW YORK, Nov. 08, 2023 (GLOBE NEWSWIRE) -- SuRo Capital Corp. (“SuRo Capital”, the “Company”, “we”, “us”, and “our”) (Nasdaq: SSSS) today announced its financial results for the quarter ended September 30, 2023. Net assets totaled approximately $212.0 million, or $8.41 per share, at September 30, 2023, as compared to $7.35 per share at June 30, 2023 and $7.83 per share at September 30, 2022. “Rising interest rates throughout the third q |
SSSS Price Returns
1-mo | 9.11% |
3-mo | 18.53% |
6-mo | 29.01% |
1-year | 28.65% |
3-year | -39.05% |
5-year | 16.63% |
YTD | 18.53% |
2023 | 3.68% |
2022 | -70.31% |
2021 | 72.62% |
2020 | 114.25% |
2019 | 25.48% |
Loading social stream, please wait...