Sensata Technologies Holding plc Ordinary Shares (ST): Price and Financial Metrics
ST Price/Volume Stats
Current price | $36.74 | 52-week high | $50.11 |
Prev. close | $36.43 | 52-week low | $30.56 |
Day low | $36.26 | Volume | 958,400 |
Day high | $36.84 | Avg. volume | 2,229,626 |
50-day MA | $34.93 | Dividend yield | 1.35% |
200-day MA | $37.16 | Market Cap | 5.53B |
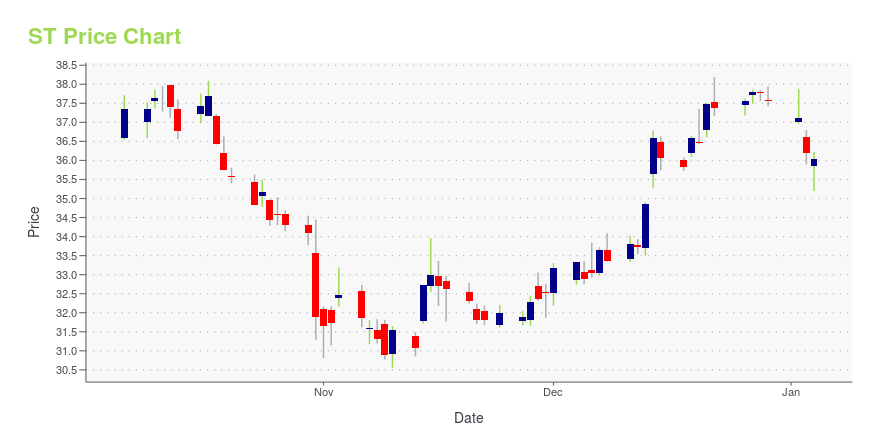
ST Stock Price Chart Interactive Chart >
ST POWR Grades
- ST scores best on the Quality dimension, with a Quality rank ahead of 79.86% of US stocks.
- ST's strongest trending metric is Stability; it's been moving down over the last 26 weeks.
- ST ranks lowest in Momentum; there it ranks in the 32nd percentile.
ST Stock Summary
- Of note is the ratio of SENSATA TECHNOLOGIES HOLDING PLC's sales and general administrative expense to its total operating expenses; only 22.62% of US stocks have a lower such ratio.
- For ST, its debt to operating expenses ratio is greater than that reported by 81.98% of US equities we're observing.
- Shareholder yield, a measure of how much is returned to shareholders via dividends and share repurchases, for ST comes in at 11.58% -- higher than that of 85.55% of stocks in our set.
- Stocks that are quantitatively similar to ST, based on their financial statements, market capitalization, and price volatility, are ACIW, TELL, EMKR, BNGO, and OPGN.
- ST's SEC filings can be seen here. And to visit SENSATA TECHNOLOGIES HOLDING PLC's official web site, go to www.sensata.com.
ST Valuation Summary
- In comparison to the median Technology stock, ST's price/sales ratio is 55.56% lower, now standing at 1.2.
- ST's price/earnings ratio has moved up 130.6 over the prior 167 months.
Below are key valuation metrics over time for ST.
Stock | Date | P/S | P/B | P/E | EV/EBIT |
---|---|---|---|---|---|
ST | 2023-12-08 | 1.2 | 1.6 | 16.2 | 14.6 |
ST | 2023-12-07 | 1.2 | 1.6 | 16.4 | 14.7 |
ST | 2023-12-06 | 1.2 | 1.6 | 16.1 | 14.5 |
ST | 2023-12-05 | 1.2 | 1.5 | 16.0 | 14.5 |
ST | 2023-12-04 | 1.2 | 1.6 | 16.2 | 14.6 |
ST | 2023-12-01 | 1.2 | 1.6 | 16.1 | 14.6 |
ST Growth Metrics
- The 4 year price growth rate now stands at -6.93%.
- Its 2 year cash and equivalents growth rate is now at 100.32%.
- Its year over year net cashflow from operations growth rate is now at -12.15%.
The table below shows ST's growth in key financial areas (numbers in millions of US dollars).
Date | Revenue | Operating Cash Flow | Net Income to Common Stock |
---|---|---|---|
2022-12-31 | 4,029.262 | 460.593 | 310.685 |
2022-09-30 | 3,949.183 | 396.658 | 309.507 |
2022-06-30 | 3,881.936 | 428.108 | 254.213 |
2022-03-31 | 3,854.048 | 496.995 | 332.288 |
2021-12-31 | 3,820.806 | 554.151 | 363.58 |
2021-09-30 | 3,792.7 | 659.663 | 373.275 |
ST's Quality Factors
The “Quality” component of the POWR Ratings focuses on 31 different factors of a companies fundamentals and operational strength. Here are some key insights as we drill into the specifics of these quality attributes.- ST has a Quality Grade of B, ranking ahead of 79.51% of graded US stocks.
- ST's asset turnover comes in at 0.457 -- ranking 50th of 75 Measuring and Control Equipment stocks.
- BMI, TT, and TRNS are the stocks whose asset turnover ratios are most correlated with ST.
The table below shows ST's key quality metrics over time.
Period | Asset Turnover | Gross Margin | ROIC |
---|---|---|---|
2021-06-30 | 0.457 | 0.330 | 0.107 |
2021-03-31 | 0.422 | 0.319 | 0.080 |
2020-12-31 | 0.416 | 0.304 | 0.068 |
2020-09-30 | 0.422 | 0.308 | 0.061 |
2020-06-30 | 0.442 | 0.314 | 0.063 |
2020-03-31 | 0.491 | 0.328 | 0.093 |
ST Price Target
For more insight on analysts targets of ST, see our ST price target page. And for a list of of all stocks sorted by upside potential based on analyst target price, see our Top Price Target page.
Average Price Target | $66.18 | Average Broker Recommendation | 1.64 (Moderate Buy) |
Sensata Technologies Holding plc Ordinary Shares (ST) Company Bio
Sensata Technologies Holdings develops, manufactures, and sells sensors and controls. It operates in two segments, Sensors and Controls. The company was founded in 1916 and is based in Almelo, the Netherlands.
Latest ST News From Around the Web
Below are the latest news stories about SENSATA TECHNOLOGIES HOLDING PLC that investors may wish to consider to help them evaluate ST as an investment opportunity.
11 Most Profitable Lithium Stocks NowIn this article, we will take a look at 11 of the most profitable lithium stocks to buy now. To skip our analysis of the lithium industry and its impacts on the battery and EV sectors, go directly to the 5 Most Profitable Lithium Stocks Now. The worldwide demand for lithium batteries has been on […] |
Is Sensata Technologies Holding plc (NYSE:ST) Trading At A 38% Discount?Key Insights The projected fair value for Sensata Technologies Holding is US$54.52 based on 2 Stage Free Cash Flow to... |
Sensata to Unveil New Electrification Initiative at CES 2024SWINDON, England, November 29, 2023--Sensata Technologies (NYSE: ST), a global industrial technology company and leading provider of sensors, sensor-rich solutions and electrical protection devices used in mission-critical systems that create valuable business insights for customers, will showcase innovative technologies and a portfolio of impactful new products that are helping lead the world’s transformation to electrification at the upcoming 2024 Consumer Electronics Show in Las Vegas, Januar |
Sensata Technologies Holding plc Announces Upcoming Redemption of 5.625% Senior Notes due 2024 by Sensata Technologies B.V.SWINDON, England, November 16, 2023--Sensata Technologies Holding plc (NYSE: ST) ("Sensata Technologies") today announced that its indirect wholly owned subsidiary, Sensata Technologies B.V. (the "Issuer"), intends to redeem in full all $400,000,000 in aggregate principal amount of its outstanding 5.625% Senior Notes due 2024 (the "Notes"). The redemption will be made in accordance with the terms of the indenture governing the Notes and the terms of the notice of redemption being delivered to al |
One bargain-bin tech stock to buyNovember's bullish market makes it smart to buy stocks opportunistically.Stocks where price has trailed business performance, and P/E ratios are historically low can offer upside.One low-valuation technology stock value investors can buy. This week's stock market rally has been driven by improving ... |
ST Price Returns
1-mo | 8.47% |
3-mo | -1.86% |
6-mo | -2.14% |
1-year | -24.10% |
3-year | -35.10% |
5-year | -16.51% |
YTD | -1.86% |
2023 | -5.87% |
2022 | -34.05% |
2021 | 16.97% |
2020 | -2.10% |
2019 | 20.14% |
ST Dividends
Ex-Dividend Date | Type | Payout Amount | Change | ||||||
---|---|---|---|---|---|---|---|---|---|
Loading, please wait... |
Continue Researching ST
Want to see what other sources are saying about Sensata Technologies Holding plc's financials and stock price? Try the links below:Sensata Technologies Holding plc (ST) Stock Price | Nasdaq
Sensata Technologies Holding plc (ST) Stock Quote, History and News - Yahoo Finance
Sensata Technologies Holding plc (ST) Stock Price and Basic Information | MarketWatch
Loading social stream, please wait...