STAAR Surgical Company (STAA): Price and Financial Metrics
GET POWR RATINGS... FREE!
STAA Price/Volume Stats
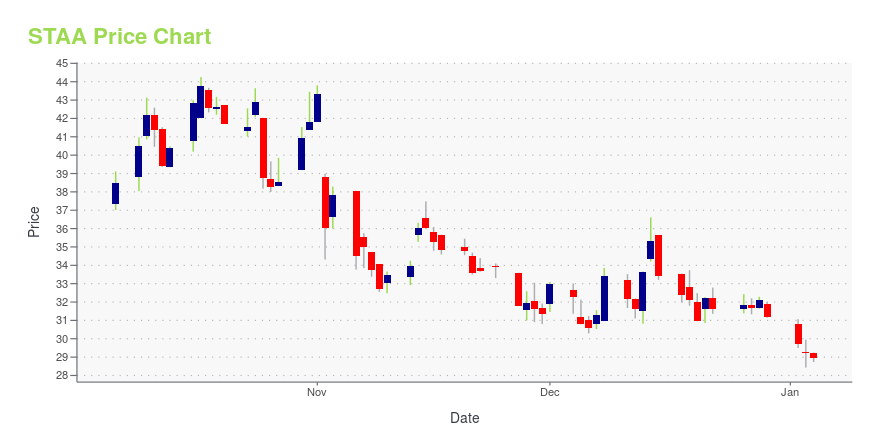
Current price | $59.79 | 52-week high | $112.27 |
Prev. close | $59.32 | 52-week low | $46.35 |
Day low | $58.54 | Volume | 440,700 |
Day high | $60.79 | Avg. volume | 671,357 |
50-day MA | $64.93 | Dividend yield | N/A |
200-day MA | $69.14 | Market Cap | 2.89B |
STAA Stock Price Chart Interactive Chart >
STAA POWR Grades
- Quality is the dimension where STAA ranks best; there it ranks ahead of 87.63% of US stocks.
- STAA's strongest trending metric is Growth; it's been moving down over the last 179 days.
- STAA's current lowest rank is in the Stability metric (where it is better than 14.46% of US stocks).
STAA Stock Summary
- With a price/earnings ratio of 91.5, STAAR SURGICAL CO P/E ratio is greater than that of about 94.19% of stocks in our set with positive earnings.
- The price/operating cash flow metric for STAAR SURGICAL CO is higher than 95.72% of stocks in our set with a positive cash flow.
- With a price/sales ratio of 9.89, STAAR SURGICAL CO has a higher such ratio than 89.36% of stocks in our set.
- Stocks with similar financial metrics, market capitalization, and price volatility to STAAR SURGICAL CO are SSTK, SLP, OSIS, LMAT, and VZIO.
- STAA's SEC filings can be seen here. And to visit STAAR SURGICAL CO's official web site, go to www.staar.com.
STAA Valuation Summary
- In comparison to the median Healthcare stock, STAA's price/sales ratio is 340.91% higher, now standing at 9.7.
- STAA's price/sales ratio has moved up 6.2 over the prior 243 months.
Below are key valuation metrics over time for STAA.
Stock | Date | P/S | P/B | P/E | EV/EBIT |
---|---|---|---|---|---|
STAA | 2023-05-23 | 9.7 | 8.4 | 89.4 | 81.0 |
STAA | 2023-05-22 | 10.6 | 9.2 | 97.7 | 88.7 |
STAA | 2023-05-19 | 10.4 | 9.0 | 96.0 | 87.1 |
STAA | 2023-05-18 | 10.5 | 9.1 | 96.9 | 87.9 |
STAA | 2023-05-17 | 10.2 | 8.9 | 94.5 | 85.7 |
STAA | 2023-05-16 | 10.1 | 8.8 | 93.8 | 85.0 |
STAA Growth Metrics
- Its 3 year price growth rate is now at 100.06%.
- The 4 year revenue growth rate now stands at 82.95%.
- The 5 year price growth rate now stands at 268.93%.

The table below shows STAA's growth in key financial areas (numbers in millions of US dollars).
Date | Revenue | Operating Cash Flow | Net Income to Common Stock |
---|---|---|---|
2022-09-30 | 279.348 | 41.243 | 37.824 |
2022-06-30 | 261.654 | 39.45 | 33.582 |
2022-03-31 | 242.92 | 32.586 | 29.111 |
2021-12-31 | 230.472 | 43.962 | 24.501 |
2021-09-30 | 217.469 | 55.014 | 22.906 |
2021-06-30 | 206.198 | 42.287 | 20.778 |
STAA's Quality Factors
The “Quality” component of the POWR Ratings focuses on 31 different factors of a companies fundamentals and operational strength. Here are some key insights as we drill into the specifics of these quality attributes.- STAA has a Quality Grade of B, ranking ahead of 92.6% of graded US stocks.
- STAA's asset turnover comes in at 0.762 -- ranking 41st of 186 Medical Equipment stocks.
- NVNO, ADMT, and BLFS are the stocks whose asset turnover ratios are most correlated with STAA.
The table below shows STAA's key quality metrics over time.
Period | Asset Turnover | Gross Margin | ROIC |
---|---|---|---|
2021-10-01 | 0.762 | 0.772 | 0.342 |
2021-07-02 | 0.784 | 0.764 | 0.341 |
2021-04-02 | 0.734 | 0.741 | 0.208 |
2021-01-01 | 0.713 | 0.724 | 0.110 |
2020-10-02 | 0.722 | 0.722 | 0.087 |
2020-07-03 | 0.720 | 0.722 | 0.056 |
STAA Price Target
For more insight on analysts targets of STAA, see our STAA price target page. And for a list of of all stocks sorted by upside potential based on analyst target price, see our Top Price Target page.
Average Price Target | $147.00 | Average Broker Recommendation | 1.5 (Moderate Buy) |
STAAR Surgical Company (STAA) Company Bio
STAAR Surgical Company designs, develops, manufactures, and sells implantable lenses for the eye, and delivery systems to deliver lenses into the eye. The company was founded in 1982 and is based in Monrovia, California.
Latest STAA News From Around the Web
Below are the latest news stories about STAAR SURGICAL CO that investors may wish to consider to help them evaluate STAA as an investment opportunity.
2 Stocks With Unstoppable Growth Potential for the Next DecadeWhen a business is making headway in a massive and uncontested global market, shareholders reap the benefits. The result could well be a run of wild growth over the next few years. Align Technology's (NASDAQ: ALGN) business model is simple: It sells its Invisalign tooth straighteners to dentists and orthodontists, who use its scanning and 3D modeling devices to adapt the straighteners to fit their patients -- thus eliminating the need to get traditional braces. |
STAAR Surgical (NASDAQ:STAA) Shareholders Will Want The ROCE Trajectory To ContinueIf we want to find a stock that could multiply over the long term, what are the underlying trends we should look for... |
EVO ICL Sponsors Jonas Brothers’ The TourLAKE FOREST, Calif., May 04, 2023--EVO ICL, the vision correction procedure that works in harmony with your natural eye, provides sharp, clear vision day or night and does not cause contact lens induced dry eye or dry eye syndrome, announced today sponsorship of the Jonas Brothers’ The Tour in North America, which begins August 12. Collaboration with the group will also include a new EVO advertising campaign slated for launch in the fall of 2023. The campaign will help drive education and awaren |
Staar Surgical (STAA) Beats Q1 Earnings and Revenue EstimatesStaar Surgical (STAA) delivered earnings and revenue surprises of 63.64% and 10.82%, respectively, for the quarter ended March 2023. Do the numbers hold clues to what lies ahead for the stock? |
STAAR Surgical Reports First Quarter 2023 ResultsLAKE FOREST, Calif., May 03, 2023--STAAR Surgical Company (NASDAQ: STAA), a leading developer, manufacturer and marketer of implantable lenses for the eye, today reported financial results for the first quarter ended March 31, 2023. |
STAA Price Returns
1-mo | -15.16% |
3-mo | 7.94% |
6-mo | 4.69% |
1-year | -10.81% |
3-year | 54.10% |
5-year | 104.41% |
YTD | 23.18% |
2022 | -46.83% |
2021 | 15.25% |
2020 | 125.25% |
2019 | 10.22% |
2018 | 105.87% |
Continue Researching STAA
Want to do more research on Staar Surgical Co's stock and its price? Try the links below:Staar Surgical Co (STAA) Stock Price | Nasdaq
Staar Surgical Co (STAA) Stock Quote, History and News - Yahoo Finance
Staar Surgical Co (STAA) Stock Price and Basic Information | MarketWatch
Loading social stream, please wait...