
Stem Inc. (STEM): Price and Financial Metrics
STEM Price/Volume Stats
| Current price | $1.27 | 52-week high | $7.79 |
| Prev. close | $1.29 | 52-week low | $0.99 |
| Day low | $1.25 | Volume | 3,160,573 |
| Day high | $1.38 | Avg. volume | 4,492,017 |
| 50-day MA | $1.25 | Dividend yield | N/A |
| 200-day MA | $2.40 | Market Cap | 205.30M |
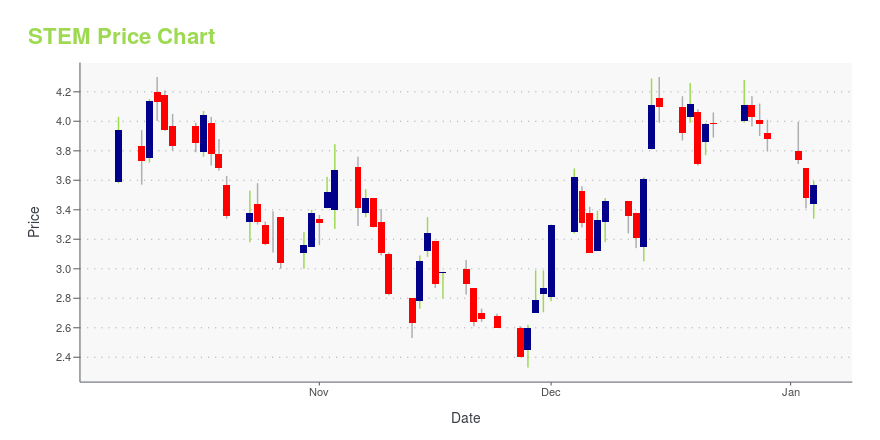
STEM Stock Price Chart Interactive Chart >
Stem Inc. (STEM) Company Bio
Stem, Inc. provides artificial intelligence (AI)-driven clean energy storage services. It delivers and operates smart battery storage solutions that maximize renewable energy generation and help build a resilient grid. The company's Athena, a AI-powered analytics platform software that uses artificial intelligence and machine learning to automatically switch between battery power, onsite generation, and grid power. Athena stabilizes the grid, reduces carbon emissions, and solves renewable intermittency across the network of distributed energy storage systems. The company serves customers, including Fortune 500 corporate energy users, project developers and installers, and utilities and independent power producers. Stem, Inc. was founded in 2009 and is headquartered in San Francisco, California.
Latest STEM News From Around the Web
Below are the latest news stories about STEM INC that investors may wish to consider to help them evaluate STEM as an investment opportunity.
3 of the Best Cheap Stocks Under $20 to Buy in DecemberMany cheap stocks under $20 have taken big hits, but a high number of them look ready to buy as the Street's fears fade. |
Stem Wins 2023 New Product Innovation Award for Energy Asset Performance OptimizationSAN FRANCISCO, November 16, 2023--Stem (NYSE: STEM), a global leader in artificial intelligence (AI)-driven clean energy software and services, announced that Frost & Sullivan, a leading global research and growth consulting firm, has awarded Stem its 2023 New Product Innovation Award in the North America energy asset performance optimization industry. Frost & Sullivan’s independent evaluation credits Stem’s continued research and development, innovative software solutions, and strong commitment |
3 Stocks to Love Despite All of the Wall Street HateWe're in the early stages of a bull market, so the Street hates most smaller companies, but these contrarian stock picks are set to soar. |
Today’s Biggest Pre-Market Stock Movers: 10 Top Gainers and Losers on FridayIt's time to dive into the biggest pre-market stock movers for Friday with all the shares investors will want to keep an eye on today! |
Stem and SB Energy Announce Technology and Commercial Alliance to Advance AI-Enabled Energy Management of Utility Scale RenewablesSAN FRANCISCO, November 02, 2023--Stem (NYSE: STEM), a global leader in AI-driven clean energy solutions and services, and SB Energy, a leading U.S. developer, owner, and operator of utility scale solar and energy storage assets, today announced that the two companies have entered a multi-year technology and commercial alliance. |
STEM Price Returns
| 1-mo | 15.45% |
| 3-mo | -30.60% |
| 6-mo | -59.55% |
| 1-year | -80.06% |
| 3-year | -95.14% |
| 5-year | N/A |
| YTD | -67.27% |
| 2023 | -56.60% |
| 2022 | -52.87% |
| 2021 | -7.28% |
| 2020 | N/A |
| 2019 | N/A |
Loading social stream, please wait...