Steel Dynamics Inc. (STLD): Price and Financial Metrics
GET POWR RATINGS... FREE!
STLD Price/Volume Stats
Current price | $95.65 | 52-week high | $136.46 |
Prev. close | $94.73 | 52-week low | $62.44 |
Day low | $94.21 | Volume | 1,285,400 |
Day high | $96.41 | Avg. volume | 1,793,302 |
50-day MA | $103.42 | Dividend yield | 1.79% |
200-day MA | $100.45 | Market Cap | 16.17B |
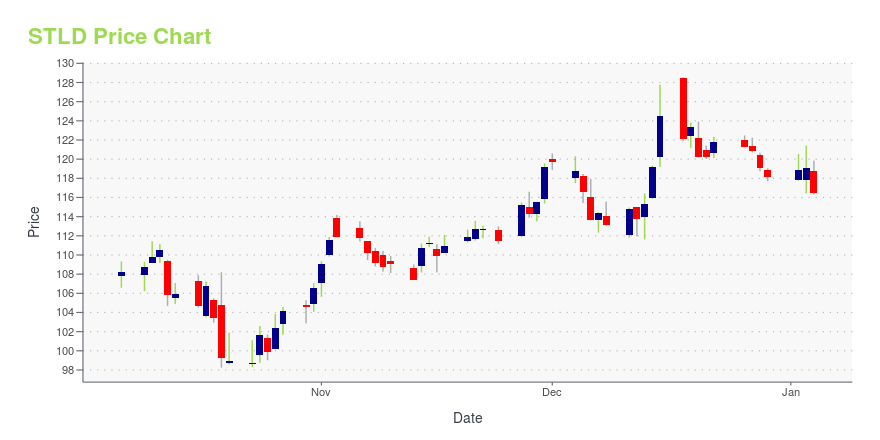
STLD Stock Price Chart Interactive Chart >
STLD POWR Grades
- STLD scores best on the Quality dimension, with a Quality rank ahead of 92.24% of US stocks.
- STLD's strongest trending metric is Growth; it's been moving down over the last 179 days.
- STLD ranks lowest in Growth; there it ranks in the 19th percentile.
STLD Stock Summary
- STLD has a market capitalization of $15,762,392,805 -- more than approximately 88.47% of US stocks.
- With a price/earnings ratio of 4.64, STEEL DYNAMICS INC P/E ratio is greater than that of about just 10.09% of stocks in our set with positive earnings.
- Shareholder yield, a measure of how much is returned to shareholders via dividends and share repurchases, for STLD comes in at 12.91% -- higher than that of 85.85% of stocks in our set.
- If you're looking for stocks that are quantitatively similar to STEEL DYNAMICS INC, a group of peers worth examining would be RE, DGX, TSN, IEX, and LEA.
- Visit STLD's SEC page to see the company's official filings. To visit the company's web site, go to www.steeldynamics.com.
STLD Valuation Summary
- In comparison to the median Basic Materials stock, STLD's price/sales ratio is 52.94% lower, now standing at 0.8.
- STLD's price/earnings ratio has moved down 1.9 over the prior 243 months.
Below are key valuation metrics over time for STLD.
Stock | Date | P/S | P/B | P/E | EV/EBIT |
---|---|---|---|---|---|
STLD | 2023-05-17 | 0.8 | 2.0 | 4.8 | 4.0 |
STLD | 2023-05-16 | 0.7 | 1.9 | 4.8 | 3.9 |
STLD | 2023-05-15 | 0.8 | 2.0 | 4.9 | 4.0 |
STLD | 2023-05-12 | 0.8 | 2.0 | 4.8 | 4.0 |
STLD | 2023-05-11 | 0.8 | 2.0 | 4.8 | 4.0 |
STLD | 2023-05-10 | 0.8 | 2.0 | 4.8 | 4.0 |
STLD Growth Metrics
- Its 5 year revenue growth rate is now at 21.64%.
- Its 2 year net cashflow from operations growth rate is now at 93.61%.
- Its 4 year revenue growth rate is now at 21.64%.

The table below shows STLD's growth in key financial areas (numbers in millions of US dollars).
Date | Revenue | Operating Cash Flow | Net Income to Common Stock |
---|---|---|---|
2022-09-30 | 22,745.14 | 4,040.874 | 4,318.315 |
2022-06-30 | 22,181.72 | 3,175.535 | 4,394.753 |
2022-03-31 | 20,434.15 | 2,760.913 | 3,887.49 |
2021-12-31 | 18,408.85 | 2,204.136 | 3,214.066 |
2021-09-30 | 15,699.44 | 1,618.188 | 2,311.404 |
2021-06-30 | 12,941.98 | 1,139.162 | 1,420.784 |
STLD's Quality Factors
The “Quality” component of the POWR Ratings focuses on 31 different factors of a companies fundamentals and operational strength. Here are some key insights as we drill into the specifics of these quality attributes.- STLD has a Quality Grade of B, ranking ahead of 77.31% of graded US stocks.
- STLD's asset turnover comes in at 1.509 -- ranking 7th of 40 Steel Works Etc stocks.
- TMST, X, and BDC are the stocks whose asset turnover ratios are most correlated with STLD.
The table below shows STLD's key quality metrics over time.
Period | Asset Turnover | Gross Margin | ROIC |
---|---|---|---|
2021-09-30 | 1.509 | 0.258 | 0.311 |
2021-06-30 | 1.338 | 0.211 | 0.206 |
2021-03-31 | 1.159 | 0.172 | 0.126 |
2020-12-31 | 1.107 | 0.149 | 0.095 |
2020-09-30 | 1.110 | 0.140 | 0.092 |
2020-06-30 | 1.156 | 0.144 | 0.104 |
STLD Price Target
For more insight on analysts targets of STLD, see our STLD price target page. And for a list of of all stocks sorted by upside potential based on analyst target price, see our Top Price Target page.
Average Price Target | $82.45 | Average Broker Recommendation | 1.58 (Moderate Buy) |
Steel Dynamics Inc. (STLD) Company Bio
Steel Dynamics, Inc., sometimes abbreviated as "SDI", is an American steel producer based in Fort Wayne, Indiana. (Source:Wikipedia)
Latest STLD News From Around the Web
Below are the latest news stories about STEEL DYNAMICS INC that investors may wish to consider to help them evaluate STLD as an investment opportunity.
PPG Industries (PPG) & Universal Display Launch OLED PlantThe new production location by PPG Industries (PPG) and UDC now employs 50 people, with the number projected to rise to up to 100 when additional investments are made. |
What Makes Steel Dynamics (STLD) a New Buy StockSteel Dynamics (STLD) has been upgraded to a Zacks Rank #2 (Buy), reflecting growing optimism about the company's earnings prospects. This might drive the stock higher in the near term. |
Steel Dynamics (STLD) Down 12.3% Since Last Earnings Report: Can It Rebound?Steel Dynamics (STLD) reported earnings 30 days ago. What's next for the stock? We take a look at earnings estimates for some clues. |
Sociedad Quimica (SQM) Q1 Earnings and Sales Miss EstimatesSociedad Quimica (SQM) sees lower year over year lithium sales volumes in the first quarter due to softer demand, especially in China. |
Hawkins (HWKN) Earnings and Revenues Top Estimates in Q4Hawkins' (HWKN) Industrial and Water Treatment segments benefit from higher selling prices on many of its products in Q4. |
STLD Price Returns
1-mo | -7.98% |
3-mo | -20.87% |
6-mo | -6.13% |
1-year | 10.83% |
3-year | 278.37% |
5-year | 121.94% |
YTD | -1.72% |
2022 | 60.14% |
2021 | 71.42% |
2020 | 12.46% |
2019 | 16.78% |
2018 | -29.02% |
STLD Dividends
Ex-Dividend Date | Type | Payout Amount | Change | ||||||
---|---|---|---|---|---|---|---|---|---|
Loading, please wait... |
Continue Researching STLD
Want to see what other sources are saying about Steel Dynamics Inc's financials and stock price? Try the links below:Steel Dynamics Inc (STLD) Stock Price | Nasdaq
Steel Dynamics Inc (STLD) Stock Quote, History and News - Yahoo Finance
Steel Dynamics Inc (STLD) Stock Price and Basic Information | MarketWatch
Loading social stream, please wait...