
Stantec Inc (STN): Price and Financial Metrics
STN Price/Volume Stats
| Current price | $86.03 | 52-week high | $87.69 |
| Prev. close | $85.24 | 52-week low | $59.55 |
| Day low | $85.14 | Volume | 76,047 |
| Day high | $86.38 | Avg. volume | 109,667 |
| 50-day MA | $82.95 | Dividend yield | 0.71% |
| 200-day MA | $78.73 | Market Cap | 9.81B |
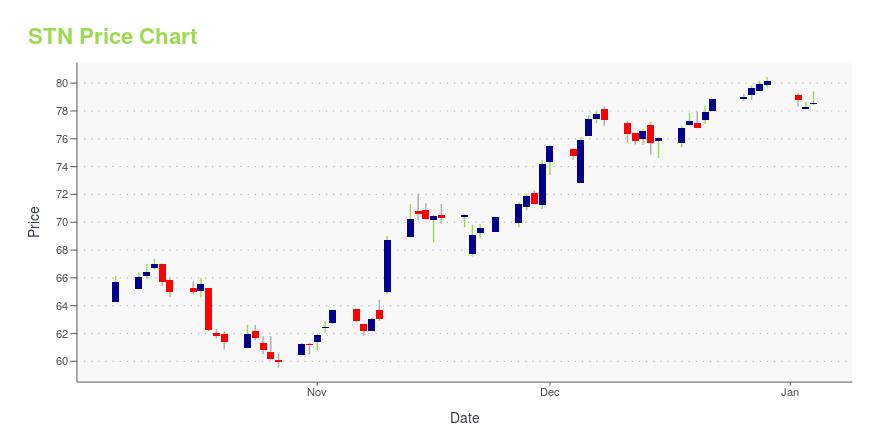
STN Stock Price Chart Interactive Chart >
Stantec Inc (STN) Company Bio
Stantec Inc. provides planning, engineering, architecture, interior design, landscape architecture, surveying, environmental sciences, project management, and project economics. The Company's three business operating units include Buildings, Energy & Resources, and Infrastructure. The company was founded in 1954 and is based in Edmonton, Canada.
Latest STN News From Around the Web
Below are the latest news stories about STANTEC INC that investors may wish to consider to help them evaluate STN as an investment opportunity.
Accenture PLC (ACN) Soars to 52-Week High, Time to Cash Out?Accenture (ACN) is at a 52-week high, but can investors hope for more gains in the future? We take a look at the company's fundamentals for clues. |
What Makes Stantec (STN) a Strong Momentum Stock: Buy Now?Does Stantec (STN) have what it takes to be a top stock pick for momentum investors? Let's find out. |
Stantec announces renewal of Normal Course Issuer Bid and Automatic Share Purchase PlanEDMONTON, Alberta, Dec. 11, 2023 (GLOBE NEWSWIRE) -- TSX, NYSE: STN Stantec Inc. (“Stantec”), a global leader in sustainable design and engineering, announced today that it has received approval from the Toronto Stock Exchange ( the “TSX”) respecting the renewal of its Normal Course Issuer Bid (“NCIB”). Pursuant to the NCIB documentation filed with the TSX, Stantec may purchase up to 2,281,339 common shares, representing approximately 2% of Stantec’s 114,066,995 issued and outstanding common sha |
Should You Think About Buying Stantec Inc. (TSE:STN) Now?Stantec Inc. ( TSE:STN ), is not the largest company out there, but it received a lot of attention from a substantial... |
Stantec Announces 2024 – 2026 Strategic Plan to Deliver Purpose Driven GrowthStantec releases three-year financial targets, including 2024 outlookEDMONTON, Alberta and BOSTON, Dec. 05, 2023 (GLOBE NEWSWIRE) -- TSX, NYSE:STN Stantec Inc. (Stantec or the Company), a global leader in sustainable design and engineering, today released the highlights of its 2024 – 2026 Strategic Plan, including its three-year financial targets and guidance for 2024. Three-Year Strategic PlanBy the end of 2026, Stantec aims to achieve: Net revenue of $7.5 billionOrganic net revenue1 growth at |
STN Price Returns
| 1-mo | 3.49% |
| 3-mo | 5.31% |
| 6-mo | 6.67% |
| 1-year | 29.37% |
| 3-year | 94.29% |
| 5-year | 279.46% |
| YTD | 7.68% |
| 2023 | 68.75% |
| 2022 | -13.74% |
| 2021 | 74.12% |
| 2020 | 16.59% |
| 2019 | 31.81% |
STN Dividends
| Ex-Dividend Date | Type | Payout Amount | Change | ||||||
|---|---|---|---|---|---|---|---|---|---|
| Loading, please wait... | |||||||||
Continue Researching STN
Want to see what other sources are saying about Stantec Inc's financials and stock price? Try the links below:Stantec Inc (STN) Stock Price | Nasdaq
Stantec Inc (STN) Stock Quote, History and News - Yahoo Finance
Stantec Inc (STN) Stock Price and Basic Information | MarketWatch
Loading social stream, please wait...