
Star Equity Holdings, Inc. (STRR): Price and Financial Metrics
STRR Price/Volume Stats
| Current price | $4.71 | 52-week high | $6.52 |
| Prev. close | $4.90 | 52-week low | $3.43 |
| Day low | $4.71 | Volume | 2,800 |
| Day high | $4.76 | Avg. volume | 12,128 |
| 50-day MA | $4.34 | Dividend yield | N/A |
| 200-day MA | $4.68 | Market Cap | 14.93M |
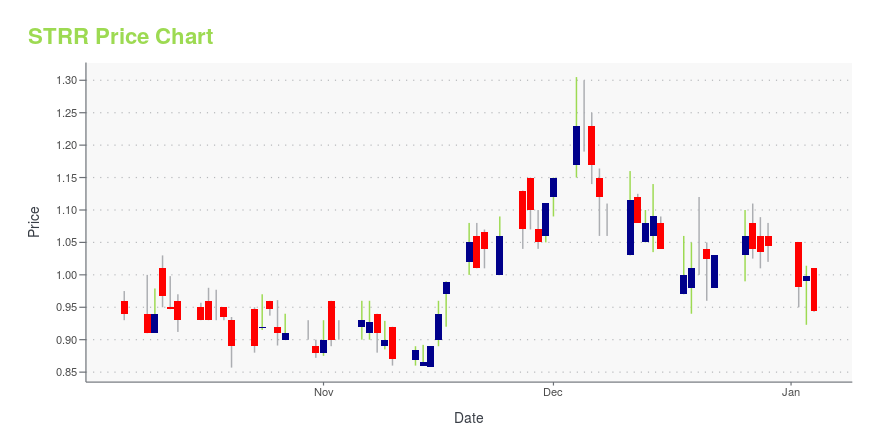
STRR Stock Price Chart Interactive Chart >
Star Equity Holdings, Inc. (STRR) Company Bio
Star Equity Holdings, Inc. is a diversified holding company with three divisions: Healthcare, Building & Construction, and Real Estate & Investments.
Latest STRR News From Around the Web
Below are the latest news stories about STAR EQUITY HOLDINGS INC that investors may wish to consider to help them evaluate STRR as an investment opportunity.
Star Equity Holdings, Inc. Declares Cash Dividend of $0.25 Per Share of 10% Series A Cumulative Perpetual Preferred StockOLD GREENWICH, Conn., Nov. 17, 2023 (GLOBE NEWSWIRE) -- Star Equity Holdings, Inc. (Nasdaq: STRR; STRRP) (“Star Equity” or the “Company”), a diversified holding company, announced today that its Board of Directors declared a cash dividend to holders of the Company’s 10% Series A Cumulative Perpetual Preferred Stock of $0.25 per share. The record date for this dividend is December 1, 2023, and the payment date is December 11, 2023. About Star Equity Holdings, Inc. Star Equity Holdings, Inc. is a |
One Star Equity Holdings, Inc. (NASDAQ:STRR) Analyst Has Been Cutting Their ForecastsToday is shaping up negative for Star Equity Holdings, Inc. ( NASDAQ:STRR ) shareholders, with the covering analyst... |
Star Equity Holdings, Inc. Announces 2023 Third Quarter Financial ResultsEnded the third quarter with cash and cash equivalents of $20.7 million; well positioned to expand existing businesses organically or grow through acquisitions of bolt-ons or new verticalsOLD GREENWICH, Conn., Nov. 08, 2023 (GLOBE NEWSWIRE) -- Star Equity Holdings, Inc. (Nasdaq: STRR; STRRP) (“Star Equity” or the “Company”), a diversified holding company, reported today its financial results for the third quarter (Q3) ended September 30, 2023. All 2023 and 2022 amounts in this release are unaudi |
Star Equity Holdings Announces Acquisition of Big Lake LumberAccretive Bolt-On Acquisition Positions Star’s Glenbrook Business as a Twin Cities Regional PlayerOLD GREENWICH, Conn., Nov. 02, 2023 (GLOBE NEWSWIRE) -- Star Equity Holdings, Inc. (Nasdaq: STRR; STRRP) (“Star” or the “Company”), a diversified holding company, announced today it has completed the acquisition of Big Lake Lumber, Inc. (“Big Lake”), a Minneapolis-based building supply center and lumber yard, effective October 31, 2023. Big Lake will be integrated into Glenbrook Building Supply, Inc |
KBS Builders Wins $1.9 Million Initial Contract for a Multi-Phase Affordable Housing Project in MaineOLD GREENWICH, Conn., Nov. 01, 2023 (GLOBE NEWSWIRE) -- Star Equity Holdings, Inc. (Nasdaq: STRR; STRRP) (“Star Equity” or the “Company”), a diversified holding company, announced today that its KBS Builders, Inc. (“KBS”) business has signed an approximately $1.9 million initial contract to manufacture 12 modules as part of a multi-phase project designed to bring affordable housing to rural Maine. This first phase of the project will provide 18 affordable rental units designed to conform with lo |
STRR Price Returns
| 1-mo | 17.75% |
| 3-mo | 4.67% |
| 6-mo | -5.80% |
| 1-year | -4.85% |
| 3-year | -74.19% |
| 5-year | N/A |
| YTD | -9.86% |
| 2023 | 22.24% |
| 2022 | -66.47% |
| 2021 | -28.97% |
| 2020 | N/A |
| 2019 | N/A |
Loading social stream, please wait...