
State Street Corp. (STT): Price and Financial Metrics
STT Price/Volume Stats
| Current price | $85.29 | 52-week high | $86.24 |
| Prev. close | $84.89 | 52-week low | $62.78 |
| Day low | $84.58 | Volume | 1,509,865 |
| Day high | $85.89 | Avg. volume | 2,301,795 |
| 50-day MA | $76.24 | Dividend yield | 3.29% |
| 200-day MA | $73.67 | Market Cap | 25.69B |
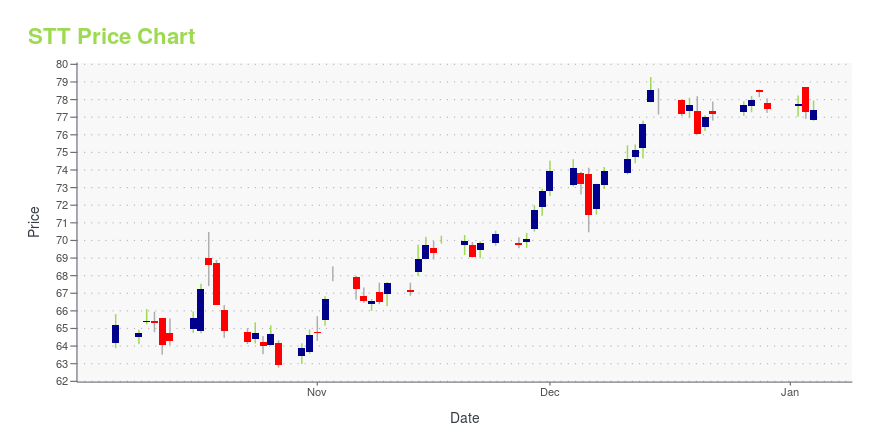
STT Stock Price Chart Interactive Chart >
State Street Corp. (STT) Company Bio
State Street Corporation is an American financial services and bank holding company headquartered at One Lincoln Street in Boston with operations worldwide. It is the second-oldest continually operating United States bank; its predecessor, Union Bank, was founded in 1792. State Street is ranked 15th on the list of largest banks in the United States by assets. It is one of the largest asset management companies in the world with US$3.9 trillion under management and US$43.3 trillion under custody and administration. It is the largest custodian bank in the world, providing securities services and it is almost considered a systemically important bank by the Financial Stability Board. (Source:Wikipedia)
Latest STT News From Around the Web
Below are the latest news stories about STATE STREET CORP that investors may wish to consider to help them evaluate STT as an investment opportunity.
State Street Corporation (NYSE:STT) Passed Our Checks, And It's About To Pay A US$0.69 DividendIt looks like State Street Corporation ( NYSE:STT ) is about to go ex-dividend in the next four days. The ex-dividend... |
There Is More Value In The Financial Sector Than Any Other SectorThanks to the great recession of 2008 and 2009, there is more value to be found in the financial sector than any other of the 11 sectors. |
UPDATE 2-US regulator looks at power utility ownership by top asset managersA member of the U.S. Federal Energy Regulatory Commission (FERC) called for scrutiny of top asset managers' ownership of power utilities, as the oversight body began a review. Critics have voiced concern about the growing share of corporate stocks held by passive investors, although FERC in May extended an authorization for big index funds to own utility shares. In a notice on its website the energy regulator said it had "launched an inquiry into whether and how to revise its policy on financial investment company ownership of electric utilities." |
Ken Griffin Is Making a Bet on Blink Charging (BLNK) StockBLNK stock is in the green after Ken Griffin's Citadel Advisors reported purchasing shares of the electric vehicle (EV) charging company. |
5 Investors Betting Big on Costco (COST) StockCOST stock is surging higher after the company reported its earnings and declared a $15 special cash dividend. |
STT Price Returns
| 1-mo | 18.16% |
| 3-mo | 17.31% |
| 6-mo | 15.66% |
| 1-year | 25.64% |
| 3-year | 10.08% |
| 5-year | 66.28% |
| YTD | 12.15% |
| 2023 | 3.54% |
| 2022 | -13.75% |
| 2021 | 31.03% |
| 2020 | -4.76% |
| 2019 | 29.35% |
STT Dividends
| Ex-Dividend Date | Type | Payout Amount | Change | ||||||
|---|---|---|---|---|---|---|---|---|---|
| Loading, please wait... | |||||||||
Continue Researching STT
Here are a few links from around the web to help you further your research on State Street Corp's stock as an investment opportunity:State Street Corp (STT) Stock Price | Nasdaq
State Street Corp (STT) Stock Quote, History and News - Yahoo Finance
State Street Corp (STT) Stock Price and Basic Information | MarketWatch
Loading social stream, please wait...