
Service Properties Trust (SVC): Price and Financial Metrics
SVC Price/Volume Stats
| Current price | $5.80 | 52-week high | $8.85 |
| Prev. close | $5.58 | 52-week low | $4.81 |
| Day low | $5.67 | Volume | 986,018 |
| Day high | $5.82 | Avg. volume | 1,074,973 |
| 50-day MA | $5.33 | Dividend yield | 13.86% |
| 200-day MA | $6.76 | Market Cap | 961.41M |
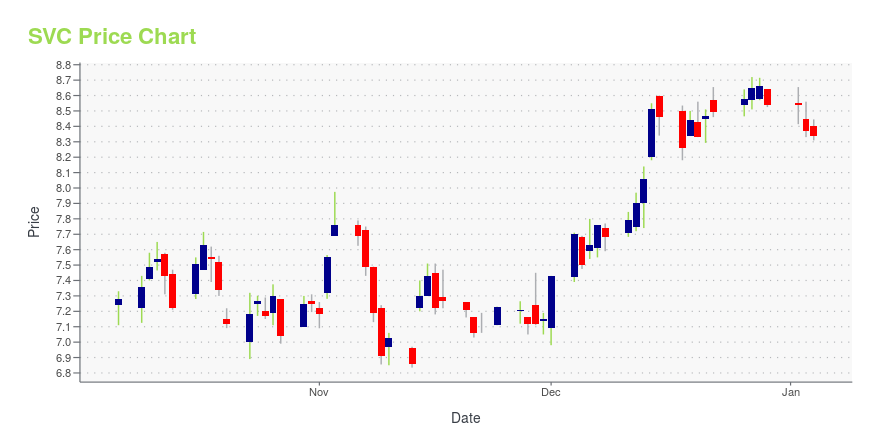
SVC Stock Price Chart Interactive Chart >
Service Properties Trust (SVC) Company Bio
Service Properties Trust operates as a real estate investment trust. The Company invests in properties, as well as provides leasing and management services. Service Properties Trust serves in the State of Massachusetts.
Latest SVC News From Around the Web
Below are the latest news stories about SERVICE PROPERTIES TRUST that investors may wish to consider to help them evaluate SVC as an investment opportunity.
REITs Crushing Estimates After Third-Quarter Sell-OffAfter a difficult third quarter that saw real estate investment trusts (REITs) hammered down in share price, REITs are making a strong comeback. Talk of high interest rates, increasing vacancies and possible recession are still all around, but take a look at several REITs that just trounced the analyst estimates for the third quarter. One Liberty Properties Inc. (NYSE:OLP) is a Great Neck, New York-based diversified REIT that owns and manages retail, office and industrial properties under long-t |
Service Properties Trust Prices $1.0 Billion of Senior Secured Notes Due 2031NEWTON, Mass., November 09, 2023--Service Properties Trust (Nasdaq: SVC) today announced that it has priced $1.0 billion aggregate principal amount of 8.625% senior secured notes due 2031. The closing is expected to occur on November 16, 2023, subject to the satisfaction of customary closing conditions. The new notes are guaranteed by certain of SVC’s subsidiaries and secured by first-priority liens on the equity interests of subsidiaries that own and lease 70 of its travel center properties to |
Q3 2023 Service Properties Trust Earnings CallQ3 2023 Service Properties Trust Earnings Call |
Service Properties Trust Announces Third Quarter 2023 ResultsNEWTON, Mass., November 06, 2023--Service Properties Trust (Nasdaq: SVC) today announced its financial results for the quarter ended September 30, 2023, which can be found at the Quarterly Results section of SVC’s website at https://www.svcreit.com/investors/financial-information/default.aspx. |
Service Properties Trust's Dividend AnalysisService Properties Trust (NASDAQ:SVC) recently announced a dividend of $0.2 per share, payable on 2023-11-16, with the ex-dividend date set for 2023-10-20. As investors look forward to this upcoming payment, the spotlight also shines on the company's dividend history, yield, and growth rates. Using the data from GuruFocus, let's delve into Service Properties Trust's dividend performance and assess its sustainability. |
SVC Price Returns
| 1-mo | 18.61% |
| 3-mo | -6.83% |
| 6-mo | -24.40% |
| 1-year | -23.11% |
| 3-year | -37.93% |
| 5-year | -69.92% |
| YTD | -28.01% |
| 2023 | 29.07% |
| 2022 | -14.50% |
| 2021 | -23.23% |
| 2020 | -51.47% |
| 2019 | 10.84% |
SVC Dividends
| Ex-Dividend Date | Type | Payout Amount | Change | ||||||
|---|---|---|---|---|---|---|---|---|---|
| Loading, please wait... | |||||||||
Loading social stream, please wait...