Save Foods Inc. (SVFD): Price and Financial Metrics
GET POWR RATINGS... FREE!
SVFD POWR Grades
- SVFD scores best on the Sentiment dimension, with a Sentiment rank ahead of 81.83% of US stocks.
- SVFD's strongest trending metric is Growth; it's been moving up over the last 59 days.
- SVFD's current lowest rank is in the Stability metric (where it is better than 0.36% of US stocks).
SVFD Stock Summary
- With a market capitalization of $3,051,606, SAVE FOODS INC has a greater market value than just 0.71% of US stocks.
- With a year-over-year growth in debt of 495.69%, SAVE FOODS INC's debt growth rate surpasses 96.61% of about US stocks.
- The volatility of SAVE FOODS INC's share price is greater than that of 95.57% US stocks with at least 200 days of trading history.
- Stocks with similar financial metrics, market capitalization, and price volatility to SAVE FOODS INC are PYCR, CYRX, SIBN, IRTC, and STIM.
- Visit SVFD's SEC page to see the company's official filings. To visit the company's web site, go to savefoods.co.
SVFD Valuation Summary
- In comparison to the median Basic Materials stock, SVFD's price/sales ratio is 588.24% higher, now standing at 11.7.
- Over the past 41 months, SVFD's price/sales ratio has gone down 18.
Below are key valuation metrics over time for SVFD.
Stock | Date | P/S | P/B | P/E | EV/EBIT |
---|---|---|---|---|---|
SVFD | 2023-03-16 | 11.7 | 0.6 | -0.7 | 0.4 |
SVFD | 2023-03-15 | 12.0 | 0.6 | -0.7 | 0.4 |
SVFD | 2023-03-14 | 12.5 | 0.6 | -0.8 | 0.4 |
SVFD | 2023-03-13 | 12.8 | 0.6 | -0.8 | 0.3 |
SVFD | 2023-03-10 | 14.2 | 0.7 | -0.9 | 0.3 |
SVFD | 2023-03-09 | 13.6 | 0.7 | -0.8 | 0.3 |
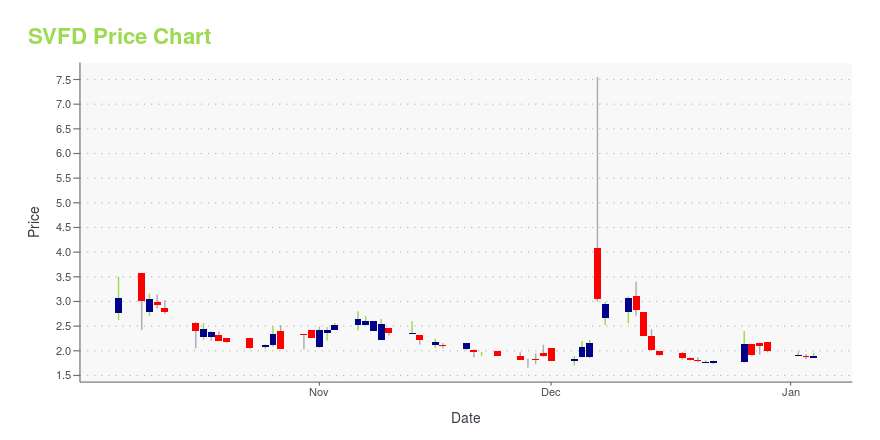
SVFD Stock Price Chart Interactive Chart >
SVFD Price/Volume Stats
Current price | $0.73 | 52-week high | $6.84 |
Prev. close | $0.67 | 52-week low | $0.63 |
Day low | $0.65 | Volume | 19,200 |
Day high | $0.73 | Avg. volume | 24,534 |
50-day MA | $1.08 | Dividend yield | N/A |
200-day MA | $2.11 | Market Cap | 2.10M |
Save Foods Inc. (SVFD) Company Bio
Save Foods, Inc. engages in the research and development of green solutions for extending storability and shelf life of vegetables and fruits. The company was founded by Nimrod Ben-Yehuda on April 1, 2009 and is headquartered in Haifa, Israel.
Latest SVFD News From Around the Web
Below are the latest news stories about SAVE FOODS INC that investors may wish to consider to help them evaluate SVFD as an investment opportunity.
Are These Relatively Little-Known Organic And Earth-Friendly Food Stocks On Your Watchlist?By Ernest Dela Aglanu, Benzinga |
The U.S Wastes About 40% Of Its Food Supply Each Year – A Look At The Future Of Waste Reduction And Food Processing In A New YearBy Ernest Dela Aglanu, Benzinga |
Save Foods Third Quarter 2022 Earnings: US$0.47 loss per share (vs US$0.46 loss in 3Q 2021)Save Foods ( NASDAQ:SVFD ) Third Quarter 2022 Results Key Financial Results Net loss: US$1.76m (loss widened by 37... |
Save Foods Kicks off the 2022-2023 Northern Hemisphere Citrus SeasonCompany expects to expand current customer base with the addition of five new packing houses and anticipates approximately 400,000 tons of citrus fruit to be treated during the season Neve Yarak, Israel, Nov. 14, 2022 (GLOBE NEWSWIRE) -- Save Foods, Inc. (NASDAQ: SVFD) (FSE:80W) (“Save Foods” or the “Company”), an agri-food tech company specializing in eco-crop protection that helps to reduce food waste and ensure food safety while reducing the use of pesticides, has kicked off the Northern Hemi |
Save Foods, Inc. Interview to Air on Bloomberg U.S. on the RedChip Money Report(R)RedChip Companies will air a new interview with Save Foods, Inc. (NASDAQ:SVFD)(FSE:80W) ("Save Foods" or the "Company"), an agri-food tech company specializing in eco crop protection that helps to reduce food waste and ensure food safety while reducing the use of pesticides, on The RedChip Money Report® on Bloomberg TV, this Saturday, November 12, at 7 p.m. Eastern Time (ET). Bloomberg TV is available in an estimated 73 million homes across the U.S. |
SVFD Price Returns
1-mo | -36.52% |
3-mo | -8.18% |
6-mo | -67.56% |
1-year | -88.26% |
3-year | N/A |
5-year | N/A |
YTD | -3.31% |
2022 | -81.17% |
2021 | -53.43% |
2020 | N/A |
2019 | N/A |
2018 | N/A |
Loading social stream, please wait...