
Savara, Inc. (SVRA): Price and Financial Metrics
SVRA Price/Volume Stats
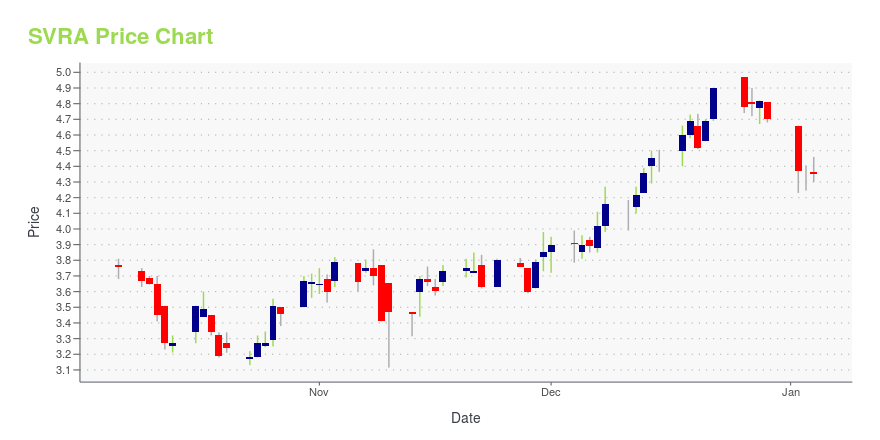
| Current price | $4.46 | 52-week high | $5.70 |
| Prev. close | $4.58 | 52-week low | $3.12 |
| Day low | $4.42 | Volume | 624,535 |
| Day high | $4.72 | Avg. volume | 1,237,881 |
| 50-day MA | $4.30 | Dividend yield | N/A |
| 200-day MA | $4.41 | Market Cap | 616.32M |
SVRA Stock Price Chart Interactive Chart >
Savara, Inc. (SVRA) Company Bio
Savara Inc., a clinical-stage specialty pharmaceutical company, focuses on the development and commercialization of novel therapies for the treatment of serious or life-threatening rare respiratory diseases. The company is based in Austin, Texas.
Latest SVRA News From Around the Web
Below are the latest news stories about SAVARA INC that investors may wish to consider to help them evaluate SVRA as an investment opportunity.
Savara Introduces aPAP ClearPath™, a GM-CSF Autoantibody Blood Test to Detect Autoimmune Pulmonary Alveolar Proteinosis (aPAP)LANGHORNE, Pa., December 21, 2023--Savara Inc. (Nasdaq: SVRA) (the Company), a clinical stage biopharmaceutical company focused on rare respiratory diseases, recently launched aPAP ClearPath™, a new serum-based blood test that can be used by physicians in the U.S. to obtain a definitive diagnosis of aPAP, a rare autoimmune lung disease mediated by autoantibodies targeting GM-CSF. Autoimmune PAP accounts for approximately 90% of all patients with PAP and has an estimated diagnosed prevalence of s |
Savara Added to the NASDAQ Biotechnology IndexLANGHORNE, Pa., December 20, 2023--Savara Inc. (Nasdaq: SVRA), a clinical stage biopharmaceutical company focused on rare respiratory diseases, today announced that the company was added to the NASDAQ Biotech Index (Nasdaq: NBI), effective prior to market open on Monday, December 18, 2023. |
Savara Announces New Employment Inducement GrantAUSTIN, Texas, December 15, 2023--Savara Inc. (Nasdaq: SVRA), a clinical stage biopharmaceutical company focused on rare respiratory diseases, today announced the grant of inducement awards to a new employee. |
Savara Inc. (NASDAQ:SVRA) most popular amongst private equity firms who own 41% of the shares, institutions hold 31%Key Insights Savara's significant private equity firms ownership suggests that the key decisions are influenced by... |
Savara to Present at the Piper Sandler 35th Annual Healthcare ConferenceLANGHORNE, Pa., November 21, 2023--Savara Inc. (Nasdaq: SVRA), a clinical stage biopharmaceutical company focused on rare respiratory diseases, today announced that its management team will participate in a fireside chat at the Piper Sandler 35th Annual Healthcare Conference on November 28, 2023 at 1:00pm PT/4:00pm ET. A live webcast of the fireside chat will be available on Savara’s website at www.savarapharma.com/investors/events-presentations/ and will be archived for 90 days. |
SVRA Price Returns
| 1-mo | 16.15% |
| 3-mo | 1.13% |
| 6-mo | -7.08% |
| 1-year | 35.98% |
| 3-year | 245.74% |
| 5-year | 70.23% |
| YTD | -5.11% |
| 2023 | 203.23% |
| 2022 | 25.00% |
| 2021 | 7.83% |
| 2020 | -74.33% |
| 2019 | -40.82% |
Loading social stream, please wait...