
ShockWave Medical, Inc. (SWAV): Price and Financial Metrics
SWAV Price/Volume Stats
| Current price | $334.75 | 52-week high | $334.90 |
| Prev. close | $334.83 | 52-week low | $157.00 |
| Day low | $334.71 | Volume | 4,714,600 |
| Day high | $334.90 | Avg. volume | 968,088 |
| 50-day MA | $325.08 | Dividend yield | N/A |
| 200-day MA | $240.56 | Market Cap | 12.57B |
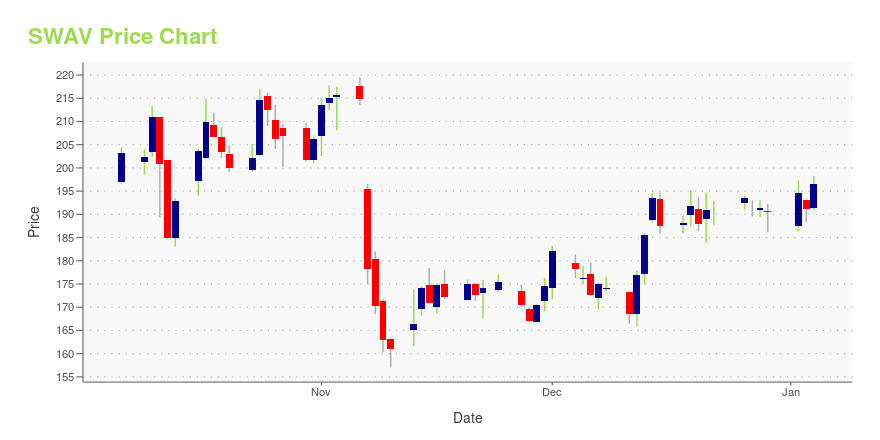
SWAV Stock Price Chart Interactive Chart >
ShockWave Medical, Inc. (SWAV) Company Bio
Shockwave Medical, Inc. operates as a medical device company. It focuses on developing and commercializing products intended to transform the way calcified cardiovascular disease is treated. The firm offers M5 catheters for treating above-the-knee peripheral artery disease; C2 catheters for treating coronary artery disease; and S4 catheters or treating below-the-knee peripheral artery disease. The company was founded by Daniel Hawkins, John M. Adams, and Todd J. Brinton in 2009 and is headquartered in Santa Clara, CA.
Latest SWAV News From Around the Web
Below are the latest news stories about SHOCKWAVE MEDICAL INC that investors may wish to consider to help them evaluate SWAV as an investment opportunity.
13 High Growth Healthcare Stocks to BuyIn this article, we will take a look at 13 high growth healthcare stocks to buy. To skip our analysis of the recent market activity, you can go directly to see the 5 Best High Growth Healthcare Stocks to Buy. For the purpose of this article, we have defined high growth stocks as stocks that […] |
Shockwave Medical to Participate in the 42nd Annual J.P. Morgan Healthcare ConferenceSANTA CLARA, Calif., Dec. 20, 2023 (GLOBE NEWSWIRE) -- Shockwave Medical, Inc. (NASDAQ: SWAV), a pioneer in the development and commercialization of transformational technologies for the treatment cardiovascular disease, announced today that the company will be participating in the 42nd Annual J.P. Morgan Healthcare Conference, which is being held from Monday, January 8 to Thursday, January 11, 2024, in San Francisco, CA. Shockwave management is scheduled for a live presentation on Wednesday, Ja |
Insider Sell Alert: President & CEO Douglas Godshall Sells 5,000 Shares of ShockWave ...ShockWave Medical Inc (NASDAQ:SWAV) has recently witnessed a significant insider sell by its President & |
What Makes Shockwave Medical (SWAV) a Potential Investment?TimesSquare Capital Management, an equity investment management company, released its “U.S. Mid Cap Growth Strategy” third-quarter investor letter. A copy of the same can be downloaded here. In the third quarter, the strategy outperformed the Russell Midcap Growth Index and returned -4.11% (net) while the index return was -5.22%. The third quarter saw a decline in […] |
Reasons to Invest in Shockwave Medical (SWAV)ClearBridge Investments, an investment management firm, released its third-quarter 2023 “Mid Cap Growth Strategy” investor letter, a copy of which can be downloaded here. The strategy underperformed its benchmark Russell Midcap Growth Index in the quarter. Overall, the effects of stock selection impacted the performance on a relative basis. The strategy gained three of the 11 […] |
SWAV Price Returns
| 1-mo | N/A |
| 3-mo | 1.44% |
| 6-mo | 47.41% |
| 1-year | 25.52% |
| 3-year | 96.58% |
| 5-year | 567.36% |
| YTD | 75.67% |
| 2023 | -7.32% |
| 2022 | 15.30% |
| 2021 | 71.93% |
| 2020 | 136.16% |
| 2019 | N/A |
Loading social stream, please wait...