Smith & Wesson Brands Inc. (SWBI): Price and Financial Metrics
GET POWR RATINGS... FREE!
SWBI POWR Grades
- SWBI scores best on the Value dimension, with a Value rank ahead of 83.2% of US stocks.
- The strongest trend for SWBI is in Quality, which has been heading down over the past 177 days.
- SWBI's current lowest rank is in the Growth metric (where it is better than 4.11% of US stocks).
SWBI Stock Summary
- Price to trailing twelve month operating cash flow for SWBI is currently 121.08, higher than 97.17% of US stocks with positive operating cash flow.
- With a year-over-year growth in debt of 62.02%, SMITH & WESSON BRANDS INC's debt growth rate surpasses 84.21% of about US stocks.
- As for revenue growth, note that SWBI's revenue has grown -48.72% over the past 12 months; that beats the revenue growth of merely 4.37% of US companies in our set.
- Stocks with similar financial metrics, market capitalization, and price volatility to SMITH & WESSON BRANDS INC are IRMD, ZCMD, ANGI, POWL, and PFIE.
- Visit SWBI's SEC page to see the company's official filings. To visit the company's web site, go to www.smith-wesson.com.
SWBI Valuation Summary
- In comparison to the median Industrials stock, SWBI's EV/EBIT ratio is 58.97% lower, now standing at 6.4.
- Over the past 243 months, SWBI's price/earnings ratio has gone down 10291.8.
Below are key valuation metrics over time for SWBI.
Stock | Date | P/S | P/B | P/E | EV/EBIT |
---|---|---|---|---|---|
SWBI | 2023-03-17 | 1 | 1.3 | 8.2 | 6.4 |
SWBI | 2023-03-16 | 1 | 1.3 | 8.4 | 6.5 |
SWBI | 2023-03-15 | 1 | 1.3 | 8.4 | 6.5 |
SWBI | 2023-03-14 | 1 | 1.3 | 8.3 | 6.5 |
SWBI | 2023-03-13 | 1 | 1.3 | 8.2 | 6.4 |
SWBI | 2023-03-10 | 1 | 1.4 | 8.4 | 6.5 |
SWBI Growth Metrics
- Its 5 year cash and equivalents growth rate is now at 103.74%.
- Its 3 year net cashflow from operations growth rate is now at 139.89%.
- The 5 year net income to common stockholders growth rate now stands at -147.89%.

The table below shows SWBI's growth in key financial areas (numbers in millions of US dollars).
Date | Revenue | Operating Cash Flow | Net Income to Common Stock |
---|---|---|---|
2022-09-30 | 564.467 | 4.285 | 79.637 |
2022-06-30 | 673.911 | 35.872 | 120.924 |
2022-03-31 | 864.126 | 137.814 | 194.494 |
2021-12-31 | 1,005.774 | 231.301 | 247.395 |
2021-09-30 | 1,085.67 | 284.835 | 279.243 |
2021-06-30 | 1,103.92 | 340.946 | 280.549 |
SWBI's Quality Factors
The “Quality” component of the POWR Ratings focuses on 31 different factors of a companies fundamentals and operational strength. Here are some key insights as we drill into the specifics of these quality attributes.- SWBI has a Quality Grade of A, ranking ahead of 99.96% of graded US stocks.
- SWBI's asset turnover comes in at 2.529 -- ranking 1st of 12 Defense stocks.
- VSTO, WRAP, and KTOS are the stocks whose asset turnover ratios are most correlated with SWBI.
The table below shows SWBI's key quality metrics over time.
Period | Asset Turnover | Gross Margin | ROIC |
---|---|---|---|
2021-07-31 | 2.529 | 0.441 | 1.627 |
2021-04-30 | 2.216 | 0.424 | 1.243 |
2021-01-31 | 1.856 | 0.402 | 0.441 |
2020-10-31 | 1.428 | 0.382 | 0.180 |
2020-07-31 | 1.109 | 0.365 | 0.030 |
2020-04-30 | 0.870 | 0.346 | -0.086 |
SWBI Price Target
For more insight on analysts targets of SWBI, see our SWBI price target page. And for a list of of all stocks sorted by upside potential based on analyst target price, see our Top Price Target page.
Average Price Target | $31.80 | Average Broker Recommendation | 1.75 (Moderate Buy) |
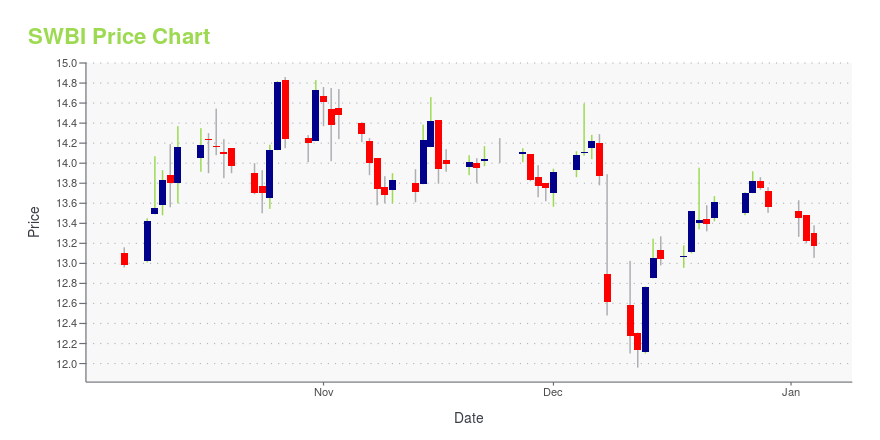
SWBI Stock Price Chart Interactive Chart >
SWBI Price/Volume Stats
Current price | $11.53 | 52-week high | $16.72 |
Prev. close | $11.38 | 52-week low | $8.20 |
Day low | $11.40 | Volume | 448,500 |
Day high | $11.53 | Avg. volume | 597,218 |
50-day MA | $10.87 | Dividend yield | 3.54% |
200-day MA | $11.66 | Market Cap | 529.20M |
Smith & Wesson Brands Inc. (SWBI) Company Bio
Smith & Wesson Brands, Inc. is a holding company, which engages in the manufacture, design, and provision of firearms. It operates through the Firearms and Outdoor Products & Accessories segments. The Firearms segment comprises the manufacture of handguns, long guns, handcuffs, suppressors, and other firearm-related products for sale to a wide variety of customers. The Outdoor Products & Accessories segment engages in the distribution, manufacture, and design of reloading, gunsmithing, and gun cleaning supplies; stainless-steel cutting tools and accessories; flashlights; tree saws and related trimming accessories; shooting supplies, rests, and other related accessories; apparel; vault accessories; laser grips and laser sights; and a full range of products for survival and emergency preparedness. The company was founded by Michell A. Saltz on June 17, 1991 and is headquartered in Springfield, MA.
Latest SWBI News From Around the Web
Below are the latest news stories about SMITH & WESSON BRANDS INC that investors may wish to consider to help them evaluate SWBI as an investment opportunity.
Those who invested in Smith & Wesson Brands (NASDAQ:SWBI) three years ago are up 95%Investors can buy low cost index fund if they want to receive the average market return. But in any diversified... |
With 59% ownership of the shares, American Outdoor Brands, Inc. (NASDAQ:AOUT) is heavily dominated by institutional ownersKey Insights Given the large stake in the stock by institutions, American Outdoor Brands' stock price might be... |
Smith & Wesson Brands Third Quarter 2023 Earnings: Beats ExpectationsSmith & Wesson Brands ( NASDAQ:SWBI ) Third Quarter 2023 Results Key Financial Results Revenue: US$129.0m (down 27... |
There's More Behind the Market's Jitters Than SVB Financial and InflationWhat's more, smaller names did what you would typically expect, falling harder, as the Russell 2000 (down 2.79%) and Russell Microcap (down 3.11%) had awful days. This came against the backdrop of a Federal Reserve admitting earlier this week the world's worst-kept secret: inflation is not under control, and additional rate hikes beyond what was previously expected may be on the horizon. Not to mention everything happening with SVB Financial and the banks. |
Q3 2023 Smith & Wesson Brands Inc Earnings CallQ3 2023 Smith & Wesson Brands Inc Earnings Call |
SWBI Price Returns
1-mo | 6.37% |
3-mo | 34.06% |
6-mo | 13.54% |
1-year | -22.52% |
3-year | 107.92% |
5-year | 54.53% |
YTD | 34.06% |
2022 | -49.58% |
2021 | 1.64% |
2020 | 150.13% |
2019 | -27.84% |
2018 | 0.16% |
SWBI Dividends
Ex-Dividend Date | Type | Payout Amount | Change | ||||||
---|---|---|---|---|---|---|---|---|---|
Loading, please wait... |
Loading social stream, please wait...