
Latham Group, Inc. (SWIM): Price and Financial Metrics
SWIM Price/Volume Stats
| Current price | $3.52 | 52-week high | $4.77 |
| Prev. close | $3.27 | 52-week low | $2.04 |
| Day low | $3.30 | Volume | 670,100 |
| Day high | $3.55 | Avg. volume | 255,123 |
| 50-day MA | $3.42 | Dividend yield | N/A |
| 200-day MA | $2.96 | Market Cap | 406.82M |
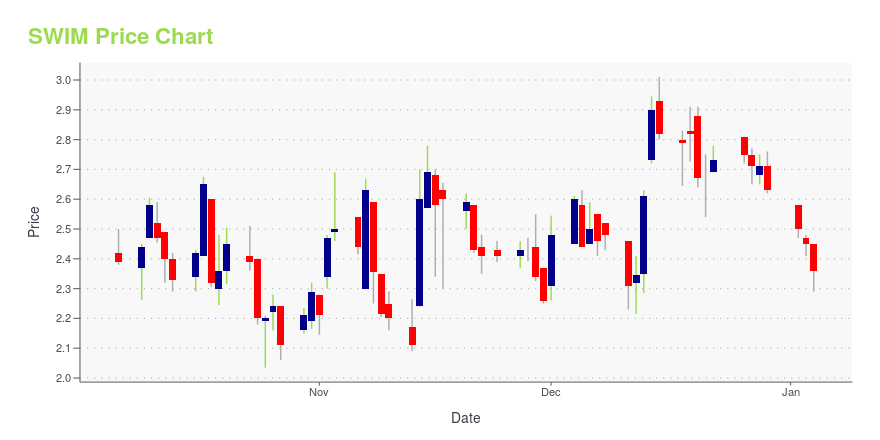
SWIM Stock Price Chart Interactive Chart >
Latham Group, Inc. (SWIM) Company Bio
Latham Group, Inc. designs, manufactures, and markets in-ground residential swimming pools. The company offers in-ground swimming pools, pool liners, and pool cover products. Latham Group, Inc. was formerly known as Latham Topco, Inc. and changed its name to Latham Group, Inc. in March 2021. Latham Group, Inc. was incorporated in 2018 and is based in Latham, New York.
Latest SWIM News From Around the Web
Below are the latest news stories about LATHAM GROUP INC that investors may wish to consider to help them evaluate SWIM as an investment opportunity.
Latham Group, Inc. (NASDAQ:SWIM) Shares Could Be 24% Below Their Intrinsic Value EstimateKey Insights Latham Group's estimated fair value is US$3.27 based on 2 Stage Free Cash Flow to Equity Latham Group's... |
Why Latham Group, Inc. (NASDAQ:SWIM) Could Be Worth WatchingLatham Group, Inc. ( NASDAQ:SWIM ), is not the largest company out there, but it received a lot of attention from a... |
Latham Group, Inc. (NASDAQ:SWIM) Q3 2023 Earnings Call TranscriptLatham Group, Inc. (NASDAQ:SWIM) Q3 2023 Earnings Call Transcript November 12, 2023 Operator: Good day, and welcome to the Latham Group Third Quarter Fiscal 2023 Earnings Conference Call. [Operator Instructions] Please note, this event is being recorded. I would now like to turn the conference over to Nicole Harlowe, Investor Relations representative. Please go ahead. […] |
Latham Group, Inc. Appoints AdvisIRy Partners as its Investor Relations and Communications FirmLATHAM, N.Y., November 13, 2023--Latham Group, Inc. ("Latham" or "the Company") (Nasdaq: SWIM), the largest designer, manufacturer, and marketer of in-ground residential swimming pools in North America, Australia and New Zealand, today announced it has appointed AdvisIRy Partners as its new investor relations and communications firm. |
Q3 2023 Latham Group Inc Earnings CallQ3 2023 Latham Group Inc Earnings Call |
SWIM Price Returns
| 1-mo | 13.00% |
| 3-mo | 15.41% |
| 6-mo | 28.47% |
| 1-year | -11.34% |
| 3-year | -87.74% |
| 5-year | N/A |
| YTD | 33.84% |
| 2023 | -18.32% |
| 2022 | -87.14% |
| 2021 | N/A |
| 2020 | N/A |
| 2019 | N/A |
Loading social stream, please wait...