Skyworks Solutions Inc. (SWKS): Price and Financial Metrics
GET POWR RATINGS... FREE!
SWKS Price/Volume Stats
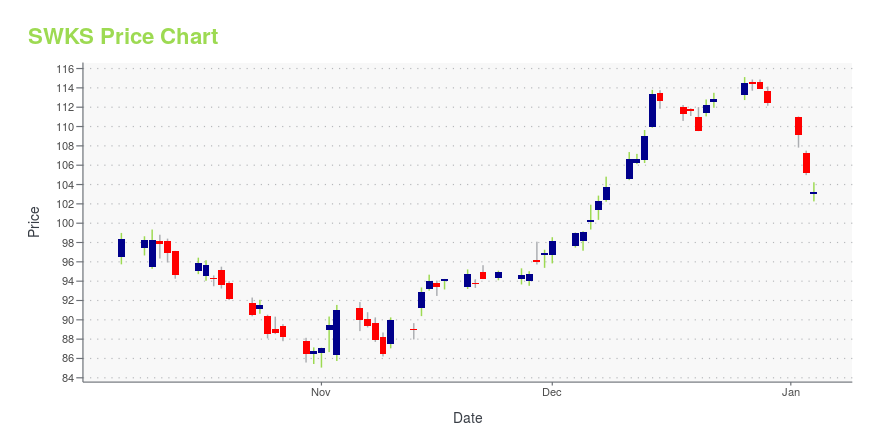
Current price | $105.05 | 52-week high | $123.69 |
Prev. close | $99.98 | 52-week low | $76.16 |
Day low | $99.81 | Volume | 2,760,500 |
Day high | $105.73 | Avg. volume | 1,930,937 |
50-day MA | $107.33 | Dividend yield | 2.48% |
200-day MA | $101.24 | Market Cap | 16.72B |
SWKS Stock Price Chart Interactive Chart >
SWKS POWR Grades
- SWKS scores best on the Momentum dimension, with a Momentum rank ahead of 84.47% of US stocks.
- The strongest trend for SWKS is in Growth, which has been heading down over the past 179 days.
- SWKS's current lowest rank is in the Growth metric (where it is better than 5.3% of US stocks).
SWKS Stock Summary
- SWKS has a higher market value than 88.45% of US stocks; more precisely, its current market capitalization is $15,722,894,394.
- SWKS's went public 37.42 years ago, making it older than 93.61% of listed US stocks we're tracking.
- Of note is the ratio of SKYWORKS SOLUTIONS INC's sales and general administrative expense to its total operating expenses; just 14.64% of US stocks have a lower such ratio.
- Stocks with similar financial metrics, market capitalization, and price volatility to SKYWORKS SOLUTIONS INC are LCID, UBX, YMAB, DCPH, and RMBS.
- Visit SWKS's SEC page to see the company's official filings. To visit the company's web site, go to www.skyworksinc.com.
SWKS Valuation Summary
- SWKS's price/sales ratio is 3.2; this is 30.61% higher than that of the median Technology stock.
- SWKS's price/sales ratio has moved up 1.4 over the prior 243 months.
Below are key valuation metrics over time for SWKS.
Stock | Date | P/S | P/B | P/E | EV/EBIT |
---|---|---|---|---|---|
SWKS | 2023-05-22 | 3.2 | 2.8 | 14.7 | 13.0 |
SWKS | 2023-05-19 | 3.2 | 2.8 | 14.6 | 12.9 |
SWKS | 2023-05-18 | 3.2 | 2.8 | 14.6 | 13.0 |
SWKS | 2023-05-17 | 3.1 | 2.8 | 14.2 | 12.6 |
SWKS | 2023-05-16 | 3.0 | 2.7 | 13.8 | 12.3 |
SWKS | 2023-05-15 | 3.1 | 2.8 | 14.2 | 12.7 |
SWKS Growth Metrics
- Its 3 year price growth rate is now at 29.6%.
- The 4 year cash and equivalents growth rate now stands at -35.15%.
- Its 3 year net income to common stockholders growth rate is now at 27.91%.

The table below shows SWKS's growth in key financial areas (numbers in millions of US dollars).
Date | Revenue | Operating Cash Flow | Net Income to Common Stock |
---|---|---|---|
2022-12-31 | 5,304.4 | 1,616.3 | 1,184.7 |
2022-09-30 | 5,485.5 | 1,424.6 | 1,275.2 |
2022-06-30 | 5,389.5 | 1,586.6 | 1,299.3 |
2022-03-31 | 5,273.3 | 1,645.7 | 1,369.8 |
2021-12-31 | 5,109.5 | 1,868.6 | 1,389 |
2021-09-30 | 5,109.1 | 1,772 | 1,498.3 |
SWKS's Quality Factors
The “Quality” component of the POWR Ratings focuses on 31 different factors of a companies fundamentals and operational strength. Here are some key insights as we drill into the specifics of these quality attributes.- SWKS has a Quality Grade of B, ranking ahead of 90.25% of graded US stocks.
- SWKS's asset turnover comes in at 0.801 -- ranking 77th of 208 Electronic Equipment stocks.
- TXN, POWI, and BDR are the stocks whose asset turnover ratios are most correlated with SWKS.
The table below shows SWKS's key quality metrics over time.
Period | Asset Turnover | Gross Margin | ROIC |
---|---|---|---|
2021-07-02 | 0.801 | 0.496 | 0.452 |
2021-04-02 | 0.820 | 0.488 | 0.450 |
2021-01-01 | 0.772 | 0.486 | 0.409 |
2020-10-02 | 0.663 | 0.481 | 0.322 |
2020-06-26 | 0.646 | 0.484 | 0.331 |
2020-03-27 | 0.659 | 0.472 | 0.351 |
SWKS Price Target
For more insight on analysts targets of SWKS, see our SWKS price target page. And for a list of of all stocks sorted by upside potential based on analyst target price, see our Top Price Target page.
Average Price Target | $212.36 | Average Broker Recommendation | 1.7 (Moderate Buy) |
Skyworks Solutions Inc. (SWKS) Company Bio
Skyworks Solutions, Inc. is an American semiconductor company headquartered in Irvine, California, United States. (Source:Wikipedia)
Latest SWKS News From Around the Web
Below are the latest news stories about SKYWORKS SOLUTIONS INC that investors may wish to consider to help them evaluate SWKS as an investment opportunity.
Earnings growth of 4.7% over 3 years hasn't been enough to translate into positive returns for Skyworks Solutions (NASDAQ:SWKS) shareholdersFor many investors, the main point of stock picking is to generate higher returns than the overall market. But in any... |
Zacks Industry Outlook Highlights Skyworks Solutions and QorvoSkyworks Solutions and Qorvo are part of the Zacks Industry Outlook article. |
Is It Time to Sell This Top iPhone Chip Supplier?What initially started as a strong rally to start 2023 has quickly turned back into pessimism for Skyworks Solutions (NASDAQ: SWKS). Smartphone sales, especially of Android devices, are in the middle of a nasty downturn -- and that's dragging down Skyworks' expected rebound for its wireless network connectivity chips. This may come as a surprise, especially considering the great quarter of device sales slow-but-steady Apple just reported. |
US equity funds see massive outflows on debt ceiling worriesU.S. equity funds faced huge outflows in the week ended May 10, on caution over the U.S. debt ceiling and concerns over disappointing earnings forecasts from some top companies. According to Refinitiv Lipper, U.S. equity funds faced outflows worth $5.7 billion, which was their seventh consecutive week of outflows. Investors were looking for an update on plans for raising the U.S. debt ceiling during the week, and worries of a potential government default as early as June 1 loom over Washington, if Congress does not act to resolve the deadlock. |
2 Radio Frequency Stocks to Watch in a Prospering IndustryThe accelerated deployment of 5G enhances the prospects of the Zacks Semiconductors - Radio Frequency industry players like Skyworks (SWKS) and Qorvo (QRVO) despite challenging macroeconomic conditions. |
SWKS Price Returns
1-mo | -0.18% |
3-mo | -5.26% |
6-mo | 11.16% |
1-year | -0.99% |
3-year | -6.54% |
5-year | 15.43% |
YTD | 16.64% |
2022 | -39.95% |
2021 | 2.73% |
2020 | 28.36% |
2019 | 84.33% |
2018 | -28.30% |
SWKS Dividends
Ex-Dividend Date | Type | Payout Amount | Change | ||||||
---|---|---|---|---|---|---|---|---|---|
Loading, please wait... |
Continue Researching SWKS
Want to see what other sources are saying about Skyworks Solutions Inc's financials and stock price? Try the links below:Skyworks Solutions Inc (SWKS) Stock Price | Nasdaq
Skyworks Solutions Inc (SWKS) Stock Quote, History and News - Yahoo Finance
Skyworks Solutions Inc (SWKS) Stock Price and Basic Information | MarketWatch
Loading social stream, please wait...