SunCoke Energy, Inc. (SXC): Price and Financial Metrics

SunCoke Energy, Inc. (SXC): $11.27

0.02 (-0.18%)

POWR Rating

Component Grades

Momentum

B

Stability

C

Sentiment

Quality

C

Add SXC to Watchlist
Sign Up

Industry: Coal

Industry

A

Ranked

#2 of 13

in industry

SXC Price/Volume Stats

Current price $11.27 52-week high $11.48
Prev. close $11.29 52-week low $6.71
Day low $11.23 Volume 728,300
Day high $11.48 Avg. volume 899,287
50-day MA $10.84 Dividend yield 3.68%
200-day MA $9.66 Market Cap 944.16M

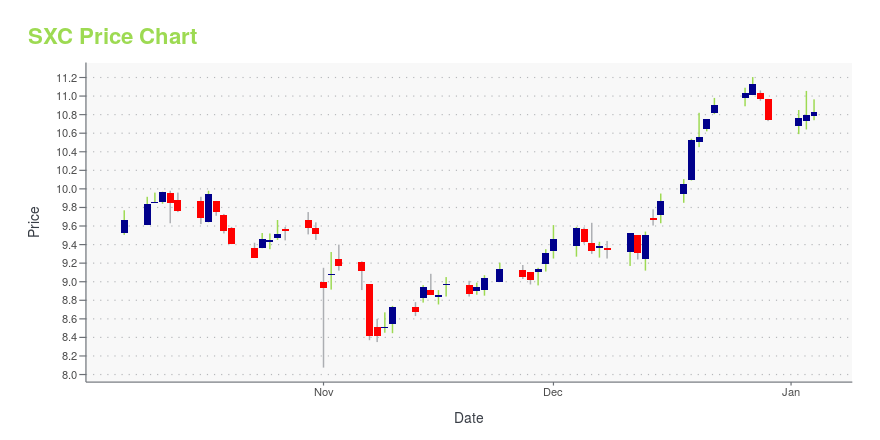
SXC Stock Price Chart Interactive Chart >

SXC POWR Grades

  • SXC scores best on the Momentum dimension, with a Momentum rank ahead of 95.48% of US stocks.
  • SXC's strongest trending metric is Momentum; it's been moving up over the last 26 weeks.
  • SXC's current lowest rank is in the Stability metric (where it is better than 49.06% of US stocks).

SXC Stock Summary

  • The price/operating cash flow metric for SUNCOKE ENERGY INC is higher than only 10.43% of stocks in our set with a positive cash flow.
  • Of note is the ratio of SUNCOKE ENERGY INC's sales and general administrative expense to its total operating expenses; only 14.65% of US stocks have a lower such ratio.
  • SXC's price/sales ratio is 0.44; that's higher than the P/S ratio of merely 14.25% of US stocks.
  • Stocks with similar financial metrics, market capitalization, and price volatility to SUNCOKE ENERGY INC are CRC, WOW, CEIX, CPA, and AMPY.
  • SXC's SEC filings can be seen here. And to visit SUNCOKE ENERGY INC's official web site, go to www.suncoke.com.

SXC Valuation Summary

  • SXC's price/sales ratio is 0.4; this is 79.49% lower than that of the median Basic Materials stock.
  • SXC's price/sales ratio has moved down 0.5 over the prior 151 months.

Below are key valuation metrics over time for SXC.

Stock Date P/S P/B P/E EV/EBIT
SXC 2023-12-29 0.4 1.5 16.2 10.9
SXC 2023-12-28 0.4 1.5 16.6 11.1
SXC 2023-12-27 0.5 1.5 16.8 11.2
SXC 2023-12-26 0.4 1.5 16.6 11.1
SXC 2023-12-22 0.4 1.5 16.4 11.0
SXC 2023-12-21 0.4 1.5 16.2 10.9

SXC Growth Metrics

    Its 2 year price growth rate is now at 126.33%.
  • Its 3 year net cashflow from operations growth rate is now at 16.61%.
  • Its 4 year revenue growth rate is now at 30.26%.
Over the past 34 months, SXC's revenue has gone up $380,800,000.

The table below shows SXC's growth in key financial areas (numbers in millions of US dollars).

Date Revenue Operating Cash Flow Net Income to Common Stock
2022-12-31 1,972.5 208.9 100.7
2022-09-30 1,823.8 169.7 101.6
2022-06-30 1,673.5 194.7 83.2
2022-03-31 1,535.9 191 56.4
2021-12-31 1,456 233.1 43.4
2021-09-30 1,400.8 218.7 25.7

SXC's Quality Factors

The “Quality” component of the POWR Ratings focuses on 31 different factors of a companies fundamentals and operational strength. Here are some key insights as we drill into the specifics of these quality attributes.
  • SXC has a Quality Grade of B, ranking ahead of 82.52% of graded US stocks.
  • SXC's asset turnover comes in at 0.874 -- ranking 23rd of 41 Steel Works Etc stocks.
  • NANX, NWPX, and NX are the stocks whose asset turnover ratios are most correlated with SXC.

The table below shows SXC's key quality metrics over time.

Period Asset Turnover Gross Margin ROIC
2021-09-30 0.874 0.234 0.042
2021-06-30 0.825 0.226 0.027
2021-03-31 0.799 0.223 0.037
2020-12-31 0.781 0.214 0.032
2020-09-30 0.815 0.205 0.036
2020-06-30 0.861 0.205 -0.063

SXC Price Target

For more insight on analysts targets of SXC, see our SXC price target page. And for a list of of all stocks sorted by upside potential based on analyst target price, see our Top Price Target page.

Average Price Target $9.50 Average Broker Recommendation 1.5 (Moderate Buy)

SunCoke Energy, Inc. (SXC) Company Bio


SunCoke Energy operates as an independent producer of coke in the Americas. The company offers metallurgical and thermal coal for use as a raw material in the blast furnace steelmaking process. The company was founded in 2010 and is based in Lisle, Illinois.


SXC Latest News Stream


Event/Time News Detail
Loading, please wait...

SXC Latest Social Stream


Loading social stream, please wait...

View Full SXC Social Stream

Latest SXC News From Around the Web

Below are the latest news stories about SUNCOKE ENERGY INC that investors may wish to consider to help them evaluate SXC as an investment opportunity.

Those who invested in SunCoke Energy (NYSE:SXC) three years ago are up 183%

The worst result, after buying shares in a company (assuming no leverage), would be if you lose all the money you put...

Yahoo | December 26, 2023

Future Fortunes: 3 Small-Cap Stocks to Turn $500 into $5,000

Are you looking to multiply your money and make a fortune?

Yiannis Zourmpanos on InvestorPlace | December 5, 2023

U.S. Steel Layoffs 2023: What to Know About the Latest U.S. Steel Job Cuts

U.S.

William White on InvestorPlace | November 29, 2023

Tomorrow’s Titans: 3 Stocks Under $10 Poised for Explosive Growth

Are you looking to invest in tomorrow's titans?

Yiannis Zourmpanos on InvestorPlace | November 20, 2023

Read This Before Considering SunCoke Energy, Inc. (NYSE:SXC) For Its Upcoming US$0.10 Dividend

Readers hoping to buy SunCoke Energy, Inc. ( NYSE:SXC ) for its dividend will need to make their move shortly, as the...

Yahoo | November 9, 2023

Read More 'SXC' Stories Here

SXC Price Returns

1-mo 8.99%
3-mo 4.93%
6-mo 12.33%
1-year 31.53%
3-year 83.38%
5-year 59.92%
YTD 4.93%
2023 29.77%
2022 35.86%
2021 56.87%
2020 -25.81%
2019 -26.25%

SXC Dividends

Ex-Dividend Date Type Payout Amount Change
Loading, please wait...
View Full SXC Dividend History

Get Free Updates

Join thousands of investors who get the latest news, insights and top rated picks from StockNews.com!