SunCoke Energy, Inc. (SXC): Price and Financial Metrics
GET POWR RATINGS... FREE!
SXC POWR Grades
- Momentum is the dimension where SXC ranks best; there it ranks ahead of 97.95% of US stocks.
- The strongest trend for SXC is in Growth, which has been heading down over the past 179 days.
- SXC's current lowest rank is in the Stability metric (where it is better than 49.07% of US stocks).
SXC Stock Summary
- Price to trailing twelve month operating cash flow for SXC is currently 3.15, higher than only 10.2% of US stocks with positive operating cash flow.
- With a price/sales ratio of 0.5, SunCoke Energy Inc has a higher such ratio than merely 11.41% of stocks in our set.
- SunCoke Energy Inc's shareholder yield -- a measure of how much capital is returned to stockholders via dividends and buybacks -- is 16.01%, greater than the shareholder yield of 89.35% of stocks in our set.
- Stocks that are quantitatively similar to SXC, based on their financial statements, market capitalization, and price volatility, are GNK, CLDT, RLJ, LPG, and CEIX.
- Visit SXC's SEC page to see the company's official filings. To visit the company's web site, go to www.suncoke.com.
SXC Valuation Summary
- In comparison to the median Basic Materials stock, SXC's price/sales ratio is 75% lower, now standing at 0.4.
- SXC's price/sales ratio has moved down 0.5 over the prior 123 months.
- Over the past 123 months, SXC's price/sales ratio has gone down 0.5.
Below are key valuation metrics over time for SXC.
Stock | Date | P/S | P/B | P/E | EV/EBIT |
---|---|---|---|---|---|
SXC | 2021-09-03 | 0.4 | 1.3 | NA | 22.0 |
SXC | 2021-09-02 | 0.4 | 1.2 | NA | 22.0 |
SXC | 2021-09-01 | 0.4 | 1.2 | NA | 21.7 |
SXC | 2021-08-31 | 0.4 | 1.2 | NA | 21.8 |
SXC | 2021-08-30 | 0.4 | 1.2 | NA | 21.9 |
SXC | 2021-08-27 | 0.4 | 1.3 | NA | 22.0 |
SXC Growth Metrics
- Its 5 year net income to common stockholders growth rate is now at -611.31%.
- The year over year net cashflow from operations growth rate now stands at 12.92%.
- Its 3 year net cashflow from operations growth rate is now at 2.76%.

The table below shows SXC's growth in key financial areas (numbers in millions of US dollars).
Date | Revenue | Operating Cash Flow | Net Income to Common Stock |
---|---|---|---|
2021-12-31 | 1,456 | 233.1 | 43.4 |
2021-09-30 | 1,400.8 | 218.7 | 25.7 |
2021-06-30 | 1,336.5 | 213.8 | 0 |
2021-03-31 | 1,310.2 | 195.8 | 15.3 |
2020-12-31 | 1,333 | 157.8 | 3.7 |
2020-09-30 | 1,420.1 | 184.5 | 7.3 |
SXC's Quality Factors
The “Quality” component of the POWR Ratings focuses on 31 different factors of a companies fundamentals and operational strength. Here are some key insights as we drill into the specifics of these quality attributes.- SXC has a Quality Grade of B, ranking ahead of 82.52% of graded US stocks.
- SXC's asset turnover comes in at 0.874 -- ranking 23rd of 41 Steel Works Etc stocks.
- NANX, NWPX, and NX are the stocks whose asset turnover ratios are most correlated with SXC.
The table below shows SXC's key quality metrics over time.
Period | Asset Turnover | Gross Margin | ROIC |
---|---|---|---|
2021-09-30 | 0.874 | 0.234 | 0.042 |
2021-06-30 | 0.825 | 0.226 | 0.027 |
2021-03-31 | 0.799 | 0.223 | 0.037 |
2020-12-31 | 0.781 | 0.214 | 0.032 |
2020-09-30 | 0.815 | 0.205 | 0.036 |
2020-06-30 | 0.861 | 0.205 | -0.063 |
SXC Price Target
For more insight on analysts targets of SXC, see our SXC price target page. And for a list of of all stocks sorted by upside potential based on analyst target price, see our Top Price Target page.
Average Price Target | $9.50 | Average Broker Recommendation | 1.5 (Moderate Buy) |
SXC Stock Price Chart Interactive Chart >
SXC Price/Volume Stats
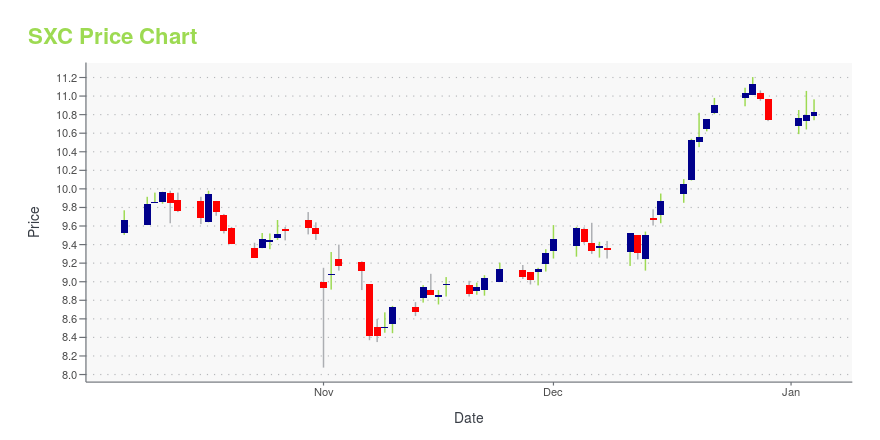
Current price | $6.81 | 52-week high | $9.82 |
Prev. close | $6.89 | 52-week low | $5.85 |
Day low | $6.65 | Volume | 1,153,100 |
Day high | $6.88 | Avg. volume | 898,415 |
50-day MA | $7.81 | Dividend yield | 3.52% |
200-day MA | $7.44 | Market Cap | 567.82M |
SunCoke Energy, Inc. (SXC) Company Bio
SunCoke Energy operates as an independent producer of coke in the Americas. The company offers metallurgical and thermal coal for use as a raw material in the blast furnace steelmaking process. The company was founded in 2010 and is based in Lisle, Illinois.
Latest SXC News From Around the Web
Below are the latest news stories about SunCoke Energy Inc that investors may wish to consider to help them evaluate SXC as an investment opportunity.
Is it Worthy to Buy SunCoke Energy (SXC) Shares?Steel City Capital, an investment management firm, published its fourth-quarter 2021 investor letter – a copy of which can be downloaded here. A quarterly portfolio net return of 8.4% was recorded by the fund for the full year of 2021. This compares to its benchmarks, the S&P 500 and Russell 2000 Index which had 26.9% […] |
What Makes SunCoke (SXC) a New Buy StockSunCoke (SXC) might move higher on growing optimism about its earnings prospects, which is reflected by its upgrade to a Zacks Rank #2 (Buy). |
11 Best Commodity Stocks To Invest InIn this article, we will look at the 11 best commodity stocks to invest in. You can skip our detailed analysis of these stocks and the commodities industry and go to 5 Best Commodity Stocks To Invest In. The coronavirus pandemic caused massive supply chain disruption across the globe as it spread, which resulted in […] |
SunCoke (SXC) Is a Great Choice for "Trend" Investors, Here's WhyIf you are looking for stocks that are well positioned to maintain their recent uptrend, SunCoke (SXC) could be a great choice. It is one of the several stocks that passed through our "Recent Price Strength" screen. |
Is SunCoke Energy (SXC) Stock Undervalued Right Now?Here at Zacks, our focus is on the proven Zacks Rank system, which emphasizes earnings estimates and estimate revisions to find great stocks. Nevertheless, we are always paying attention to the latest value, growth, and momentum trends to underscore strong picks. |
SXC Price Returns
1-mo | -16.24% |
3-mo | -24.00% |
6-mo | 4.96% |
1-year | -2.63% |
3-year | -6.74% |
5-year | -29.33% |
YTD | 4.96% |
2021 | 56.87% |
2020 | -25.81% |
2019 | -26.25% |
2018 | -28.69% |
2017 | 5.73% |
SXC Dividends
Ex-Dividend Date | Type | Payout Amount | Change | ||||||
---|---|---|---|---|---|---|---|---|---|
Loading, please wait... |
Continue Researching SXC
Want to do more research on SunCoke Energy Inc's stock and its price? Try the links below:SunCoke Energy Inc (SXC) Stock Price | Nasdaq
SunCoke Energy Inc (SXC) Stock Quote, History and News - Yahoo Finance
SunCoke Energy Inc (SXC) Stock Price and Basic Information | MarketWatch
Loading social stream, please wait...