
Standex International Corporation (SXI): Price and Financial Metrics
SXI Price/Volume Stats
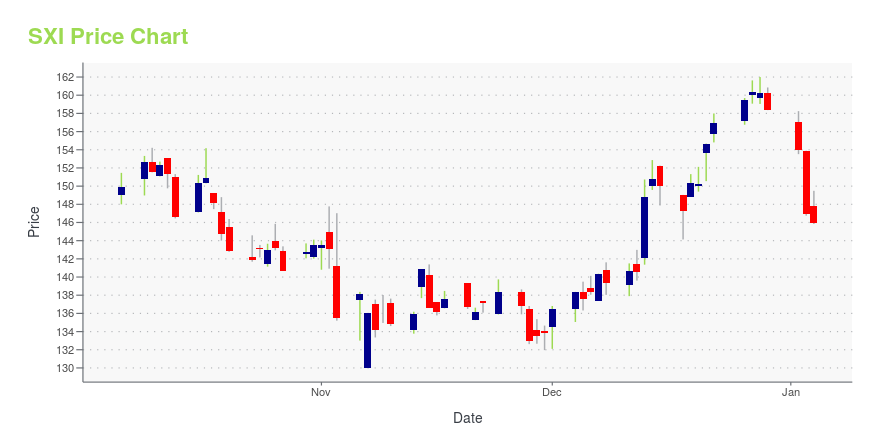
| Current price | $186.87 | 52-week high | $191.18 |
| Prev. close | $185.28 | 52-week low | $130.04 |
| Day low | $185.56 | Volume | 59,202 |
| Day high | $189.57 | Avg. volume | 62,974 |
| 50-day MA | $168.77 | Dividend yield | 0.65% |
| 200-day MA | $159.91 | Market Cap | 2.19B |
SXI Stock Price Chart Interactive Chart >
Standex International Corporation (SXI) Company Bio
Standex International Corporation manufactures and sells various products and services for diverse commercial and industrial market segments in the United States and internationally. The company was founded in 1955 and is based in Salem, New Hampshire.
Latest SXI News From Around the Web
Below are the latest news stories about STANDEX INTERNATIONAL CORP that investors may wish to consider to help them evaluate SXI as an investment opportunity.
Should You Investigate Standex International Corporation (NYSE:SXI) At US$141?Standex International Corporation ( NYSE:SXI ), might not be a large cap stock, but it saw significant share price... |
STANDEX TO PARTICIPATE IN WOLFE RESEARCH SMALL AND MID-CAP CONFERENCEStandex International Corporation (NYSE: SXI) announced today that Ademir Sarcevic, CFO, will be participating in the Wolfe Research 1st Annual Small and Mid-Cap Conference in New York City on Thursday, December 7, 2023. |
Is There An Opportunity With Standex International Corporation's (NYSE:SXI) 27% Undervaluation?Key Insights Standex International's estimated fair value is US$189 based on 2 Stage Free Cash Flow to Equity Standex... |
Insider Sell: Standex International Corp's Ademir Sarcevic Offloads 2,000 SharesIn a notable insider transaction, Ademir Sarcevic, the Vice President, Chief Financial Officer, and Treasurer of Standex International Corp (NYSE:SXI), sold 2,000 shares of the company on November 13, 2023. |
Standex International Corporation (NYSE:SXI) Q1 2024 Earnings Call TranscriptStandex International Corporation (NYSE:SXI) Q1 2024 Earnings Call Transcript November 3, 2023 Operator: Good morning, and welcome to the Standex International Fiscal First Quarter 2024 Financial Results Call. All participants will be in listen-only mode. [Operator Instructions] After today’s presentation, there’ll be an opportunity to ask questions. Please note this event is being recorded. I […] |
SXI Price Returns
| 1-mo | 17.09% |
| 3-mo | 8.32% |
| 6-mo | 27.89% |
| 1-year | 30.44% |
| 3-year | 110.52% |
| 5-year | 182.57% |
| YTD | 18.42% |
| 2023 | 55.95% |
| 2022 | -6.46% |
| 2021 | 44.19% |
| 2020 | -0.78% |
| 2019 | 19.49% |
SXI Dividends
| Ex-Dividend Date | Type | Payout Amount | Change | ||||||
|---|---|---|---|---|---|---|---|---|---|
| Loading, please wait... | |||||||||
Continue Researching SXI
Here are a few links from around the web to help you further your research on Standex International Corp's stock as an investment opportunity:Standex International Corp (SXI) Stock Price | Nasdaq
Standex International Corp (SXI) Stock Quote, History and News - Yahoo Finance
Standex International Corp (SXI) Stock Price and Basic Information | MarketWatch
Loading social stream, please wait...