Sensient Technologies Corporation (SXT): Price and Financial Metrics
GET POWR RATINGS... FREE!
SXT POWR Grades
- SXT scores best on the Stability dimension, with a Stability rank ahead of 85.99% of US stocks.
- SXT's strongest trending metric is Momentum; it's been moving down over the last 177 days.
- SXT's current lowest rank is in the Value metric (where it is better than 25.62% of US stocks).
SXT Stock Summary
- SXT's went public 35.25 years ago, making it older than 90.34% of listed US stocks we're tracking.
- The price/operating cash flow metric for SENSIENT TECHNOLOGIES CORP is higher than 98.7% of stocks in our set with a positive cash flow.
- Of note is the ratio of SENSIENT TECHNOLOGIES CORP's sales and general administrative expense to its total operating expenses; 87.12% of US stocks have a lower such ratio.
- If you're looking for stocks that are quantitatively similar to SENSIENT TECHNOLOGIES CORP, a group of peers worth examining would be CLFD, LINC, VIRC, HAIN, and ALG.
- SXT's SEC filings can be seen here. And to visit SENSIENT TECHNOLOGIES CORP's official web site, go to www.sensient.com.
SXT Valuation Summary
- In comparison to the median Basic Materials stock, SXT's price/sales ratio is 22.22% higher, now standing at 2.2.
- Over the past 243 months, SXT's price/sales ratio has gone up 1.2.
Below are key valuation metrics over time for SXT.
Stock | Date | P/S | P/B | P/E | EV/EBIT |
---|---|---|---|---|---|
SXT | 2023-03-24 | 2.2 | 3.1 | 22.0 | 18.9 |
SXT | 2023-03-23 | 2.1 | 3.0 | 21.3 | 18.5 |
SXT | 2023-03-22 | 2.1 | 3.0 | 21.1 | 18.3 |
SXT | 2023-03-21 | 2.1 | 3.0 | 21.5 | 18.6 |
SXT | 2023-03-20 | 2.1 | 3.0 | 21.3 | 18.5 |
SXT | 2023-03-17 | 2.1 | 3.0 | 21.0 | 18.2 |
SXT Growth Metrics
- The 5 year net income to common stockholders growth rate now stands at -35.34%.
- Its 4 year price growth rate is now at -42.63%.
- Its 5 year revenue growth rate is now at -4.05%.

The table below shows SXT's growth in key financial areas (numbers in millions of US dollars).
Date | Revenue | Operating Cash Flow | Net Income to Common Stock |
---|---|---|---|
2022-12-31 | 1,437.039 | 12.07 | 140.887 |
2022-09-30 | 1,428.751 | 43.968 | 138.995 |
2022-06-30 | 1,411.962 | 78.75 | 136.859 |
2022-03-31 | 1,376.083 | 115.362 | 124.148 |
2021-12-31 | 1,380.264 | 145.218 | 118.745 |
2021-09-30 | 1,374.484 | 192.001 | 116.685 |
SXT's Quality Factors
The “Quality” component of the POWR Ratings focuses on 31 different factors of a companies fundamentals and operational strength. Here are some key insights as we drill into the specifics of these quality attributes.- SXT has a Quality Grade of B, ranking ahead of 78.34% of graded US stocks.
- SXT's asset turnover comes in at 0.798 -- ranking 27th of 89 Chemicals stocks.
- GCP, CSWI, and GURE are the stocks whose asset turnover ratios are most correlated with SXT.
The table below shows SXT's key quality metrics over time.
Period | Asset Turnover | Gross Margin | ROIC |
---|---|---|---|
2021-09-30 | 0.798 | 0.325 | 0.105 |
2021-06-30 | 0.788 | 0.323 | 0.100 |
2021-03-31 | 0.783 | 0.319 | 0.103 |
2020-12-31 | 0.781 | 0.318 | 0.095 |
2020-09-30 | 0.772 | 0.308 | 0.063 |
2020-06-30 | 0.761 | 0.307 | 0.060 |
SXT Price Target
For more insight on analysts targets of SXT, see our SXT price target page. And for a list of of all stocks sorted by upside potential based on analyst target price, see our Top Price Target page.
Average Price Target | $96.75 | Average Broker Recommendation | 1.83 (Hold) |
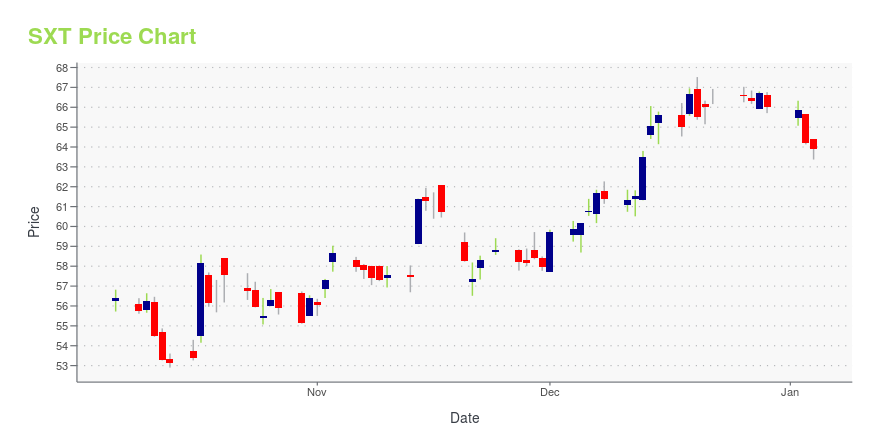
SXT Stock Price Chart Interactive Chart >
SXT Price/Volume Stats
Current price | $74.41 | 52-week high | $89.34 |
Prev. close | $74.63 | 52-week low | $63.17 |
Day low | $74.25 | Volume | 102,500 |
Day high | $75.38 | Avg. volume | 174,670 |
50-day MA | $74.29 | Dividend yield | 2.21% |
200-day MA | $75.73 | Market Cap | 3.14B |
Sensient Technologies Corporation (SXT) Company Bio
Sensient Technologies is a global manufacturer and marketer of colors, flavors and fragrances, used in specialty food and beverage systems, cosmetic and pharmaceutical systems, inkjet and specialty inks and colors, and other specialty and fine chemicals. The company was founded in 1882 and is based in Milwaukee, Wisconsin.
Latest SXT News From Around the Web
Below are the latest news stories about SENSIENT TECHNOLOGIES CORP that investors may wish to consider to help them evaluate SXT as an investment opportunity.
Sensient Technologies Could Serve Up a Tasty RallySensient Technologies Corp. is a global manufacturer and marketer of colors, flavors, and other specialty ingredients. The trading volume has increased since October and the On-Balance-Volume (OBV) line shows a choppy rise from late October indicating that buyers of SXT have been more aggressive than sellers. The OBV line shows a decline from November 2021. |
The total return for Sensient Technologies (NYSE:SXT) investors has risen faster than earnings growth over the last three yearsBy buying an index fund, investors can approximate the average market return. But if you choose individual stocks with... |
Sensient Technologies Full Year 2022 Earnings: In Line With ExpectationsSensient Technologies ( NYSE:SXT ) Full Year 2022 Results Key Financial Results Revenue: US$1.44b (up 4.1% from FY... |
Sensient Technologies Corporation Reports Results for the Quarter Ended December 31, 2022MILWAUKEE, February 10, 2023--Sensient Technologies Corporation (NYSE: SXT) reported consolidated revenue of $348.7 million in this year’s fourth quarter compared to $340.4 million in last year’s fourth quarter. Reported operating income in the fourth quarter of 2022 was $41.2 million compared to $40.4 million in the fourth quarter of 2021. Reported diluted earnings per share was 69 cents in the fourth quarter of 2022 compared to 65 cents in the fourth quarter of 2021. Foreign currency translati |
Sensient Announces Conference CallMILWAUKEE, January 27, 2023--Sensient Technologies Corporation (NYSE: SXT) will hold its conference call to discuss 2022 fourth quarter and year-end results at 8:30 a.m. CST on Friday, February 10, 2023. To participate in the conference call, contact Chorus Call Inc. at (844) 492-3726 or (412) 317-1078, and ask to join the Sensient Technologies Corporation conference call. Alternatively, the call can be accessed by using the webcast link that will be available on the Investor Information section |
SXT Price Returns
1-mo | -0.77% |
3-mo | 2.58% |
6-mo | 8.54% |
1-year | -9.49% |
3-year | 82.86% |
5-year | 17.80% |
YTD | 2.58% |
2022 | -25.61% |
2021 | 38.25% |
2020 | 14.86% |
2019 | 21.00% |
2018 | -22.13% |
SXT Dividends
Ex-Dividend Date | Type | Payout Amount | Change | ||||||
---|---|---|---|---|---|---|---|---|---|
Loading, please wait... |
Continue Researching SXT
Want to do more research on Sensient Technologies Corp's stock and its price? Try the links below:Sensient Technologies Corp (SXT) Stock Price | Nasdaq
Sensient Technologies Corp (SXT) Stock Quote, History and News - Yahoo Finance
Sensient Technologies Corp (SXT) Stock Price and Basic Information | MarketWatch
Loading social stream, please wait...