
Stock Yards Bancorp, Inc. (SYBT): Price and Financial Metrics
SYBT Price/Volume Stats
| Current price | $63.27 | 52-week high | $64.51 |
| Prev. close | $63.60 | 52-week low | $36.93 |
| Day low | $61.57 | Volume | 157,649 |
| Day high | $64.12 | Avg. volume | 85,848 |
| 50-day MA | $50.05 | Dividend yield | 2.04% |
| 200-day MA | $47.13 | Market Cap | 1.86B |
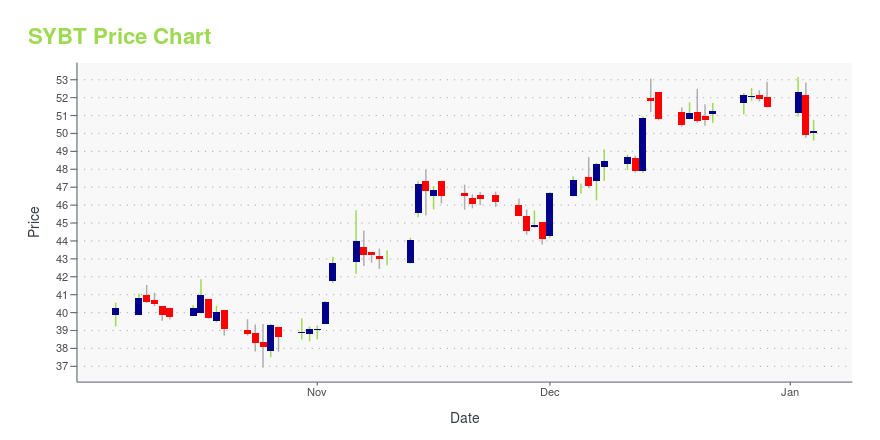
SYBT Stock Price Chart Interactive Chart >
Stock Yards Bancorp, Inc. (SYBT) Company Bio
Stock Yards Bancorp, Inc. provides commercial and personal banking services in Kentucky, southern Indiana, Indianapolis, Indiana, and Cincinnati. The company was founded in 1904 and is based in Louisville, Kentucky.
Latest SYBT News From Around the Web
Below are the latest news stories about STOCK YARDS BANCORP INC that investors may wish to consider to help them evaluate SYBT as an investment opportunity.
Stock Yards Bancorp Inc's Dividend AnalysisStock Yards Bancorp Inc (NASDAQ:SYBT) recently announced a dividend of $0.3 per share, payable on 2023-12-29, with the ex-dividend date set for 2023-12-15. As investors look forward to this upcoming payment, the spotlight also shines on the company's dividend history, yield, and growth rates. Using the data from GuruFocus, let's look into Stock Yards Bancorp Inc's dividend performance and assess its sustainability. |
Stock Yards Bancorp (NASDAQ:SYBT) shareholders have earned a 11% CAGR over the last five yearsIf you buy and hold a stock for many years, you'd hope to be making a profit. Better yet, you'd like to see the share... |
Stock Yards Bancorp Declares Quarterly Cash Dividend of $0.30 per Common ShareLOUISVILLE, Ky., Nov. 22, 2023 (GLOBE NEWSWIRE) -- Stock Yards Bancorp, Inc. (NASDAQ: SYBT), parent company of Stock Yards Bank & Trust Company, with offices in the Louisville, central, eastern and northern Kentucky, as well as the Indianapolis, Indiana and Cincinnati, Ohio metropolitan markets, announced that its Board of Directors has declared a quarterly cash dividend of $0.30 per common share. The dividend will be paid on December 29, 2023, to stockholders of record as of December 18, 2023. |
Stock Yards Bancorp to Participate in the Piper Sandler 2023 East Coast Financial Services ConferenceLOUISVILLE, Ky., Nov. 08, 2023 (GLOBE NEWSWIRE) -- Stock Yards Bancorp, Inc. (NASDAQ: SYBT), parent company of Stock Yards Bank & Trust Company, with offices in Louisville, central, eastern and northern Kentucky, as well as the Indianapolis, Indiana and Cincinnati, Ohio metropolitan markets, today announced that Ja Hillebrand, Chairman and CEO and T. Clay Stinnett, EVP and CFO will participate in the Piper Sandler 2023 East Coast Financial Services Conference to be held November 15th and 16th, a |
Is Now The Time To Put Stock Yards Bancorp (NASDAQ:SYBT) On Your Watchlist?Investors are often guided by the idea of discovering 'the next big thing', even if that means buying 'story stocks... |
SYBT Price Returns
| 1-mo | 32.20% |
| 3-mo | 37.97% |
| 6-mo | 25.40% |
| 1-year | 33.38% |
| 3-year | 42.55% |
| 5-year | 90.02% |
| YTD | 24.52% |
| 2023 | -18.84% |
| 2022 | 3.64% |
| 2021 | 60.96% |
| 2020 | 1.66% |
| 2019 | 28.72% |
SYBT Dividends
| Ex-Dividend Date | Type | Payout Amount | Change | ||||||
|---|---|---|---|---|---|---|---|---|---|
| Loading, please wait... | |||||||||
Continue Researching SYBT
Want to see what other sources are saying about Stock Yards Bancorp Inc's financials and stock price? Try the links below:Stock Yards Bancorp Inc (SYBT) Stock Price | Nasdaq
Stock Yards Bancorp Inc (SYBT) Stock Quote, History and News - Yahoo Finance
Stock Yards Bancorp Inc (SYBT) Stock Price and Basic Information | MarketWatch
Loading social stream, please wait...