
Taoping Inc. (TAOP): Price and Financial Metrics
TAOP Price/Volume Stats
| Current price | $0.62 | 52-week high | $6.20 |
| Prev. close | $0.63 | 52-week low | $0.59 |
| Day low | $0.61 | Volume | 145,145 |
| Day high | $0.65 | Avg. volume | 578,210 |
| 50-day MA | $0.72 | Dividend yield | N/A |
| 200-day MA | $1.17 | Market Cap | 1.78M |
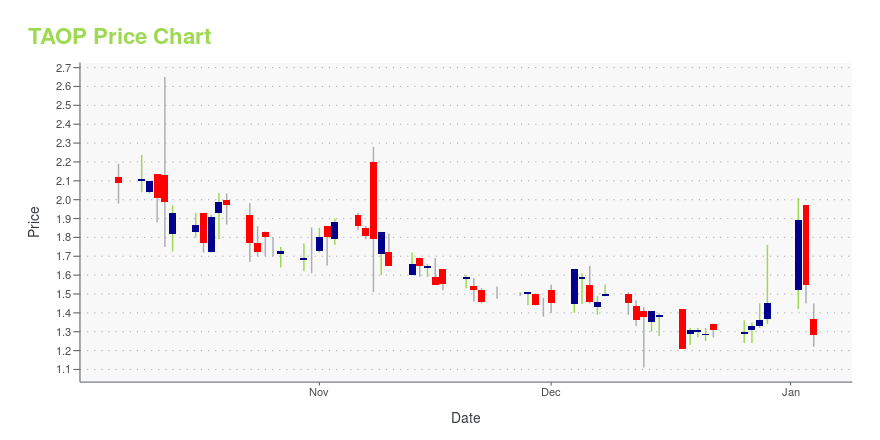
TAOP Stock Price Chart Interactive Chart >
Taoping Inc. (TAOP) Company Bio
Taoping Inc. provides integrated cloud-based platform and exchange and big data solutions to the Chinese new media industry. The Company's Internet ecosystem enables brand promotion, knowledge dissemination, and exchange of advertising resources through its proprietary Cloud-Application-Terminal technology.
Latest TAOP News From Around the Web
Below are the latest news stories about TAOPING INC that investors may wish to consider to help them evaluate TAOP as an investment opportunity.
Taoping Awarded RMB15 Million Cloud-Based Data Analytics Services Contract; Expands Reach to Mining IndustryTaoping Inc. (Nasdaq: TAOP, the "Company"), today announced the Company was awarded a RMB15 million contract to provide integrated, cloud-based data analytics services to Shenzhen Chuangzhi Tiancheng Tech Co Ltd. to facilitate the intelligent operation and management of its mining project located in Northwest China, while greatly improving operating efficiency and safety. |
Taoping Awarded RMB10 Million Cloud-Based Advertising Services ContractTaoping Inc. (Nasdaq: TAOP, the "Company"), today announced the Company was awarded a RMB10 million contract to provide cloud-based advertising services to Shenzhen Zhaoyou Tech Co. Ltd. Taoping expects to recognize the full RMB10 million in revenue in 1Q 2024. |
ALERT: Taoping Contract Revenue Value Jumps Nearly 100% in First Nine Months of 2023Taoping Inc. (Nasdaq: TAOP, the "Company"), today reported a nearly 100% year-over-year increase in the Company's contract revenue value for its cloud-based product, software and advertising businesses in the first nine months of 2023. The Company entered into contracts totaling RMB 191 million (approximately US$26.55 million) during the first nine months of 2023, the revenues from which the Company expects to recognize within fiscal year 2023. |
Today’s Biggest Pre-Market Stock Movers: 10 Top Gainers and Losers on FridayPre-market stock movers are a hot topic this morning and we're checking on the biggest ones investors will want to watch on Friday! |
Why Chinese Tech Stocks Are FallingIn this article, we discuss why the Chinese tech stocks are falling. If you want to skip our detailed discussion on the Chinese stock market and technology sector, head directly to Top 5 Falling Chinese Tech Stocks. The landscape of doing business in China is becoming progressively more arduous, as the Biden administration on August […] |
TAOP Price Returns
| 1-mo | -16.93% |
| 3-mo | -36.74% |
| 6-mo | -43.12% |
| 1-year | -87.41% |
| 3-year | -97.99% |
| 5-year | -98.43% |
| YTD | -57.24% |
| 2023 | -77.71% |
| 2022 | -65.58% |
| 2021 | -33.45% |
| 2020 | -15.48% |
| 2019 | -53.33% |
Continue Researching TAOP
Want to do more research on Taoping Inc's stock and its price? Try the links below:Taoping Inc (TAOP) Stock Price | Nasdaq
Taoping Inc (TAOP) Stock Quote, History and News - Yahoo Finance
Taoping Inc (TAOP) Stock Price and Basic Information | MarketWatch
Loading social stream, please wait...