Taro Pharmaceutical Industries Ltd. (TARO): Price and Financial Metrics


Taro Pharmaceutical Industries Ltd. (TARO): $24.00

0.70 (+3.00%)

POWR Rating

Component Grades

Growth

S

Value

I

Momentum

G

Stability

N

Sentiment

U

Quality

P

TARO POWR Grades

  • TARO scores best on the Value dimension, with a Value rank ahead of 96.39% of US stocks.
  • The strongest trend for TARO is in Growth, which has been heading down over the past 177 days.
  • TARO's current lowest rank is in the Growth metric (where it is better than 9.42% of US stocks).

TARO Stock Summary

  • The ratio of debt to operating expenses for TARO PHARMACEUTICAL INDUSTRIES LTD is higher than it is for about just 0.44% of US stocks.
  • Equity multiplier, or assets relative to shareholders' equity, comes in at 1.25 for TARO PHARMACEUTICAL INDUSTRIES LTD; that's greater than it is for just 15.55% of US stocks.
  • In terms of twelve month growth in earnings before interest and taxes, TARO PHARMACEUTICAL INDUSTRIES LTD is reporting a growth rate of -1,171.59%; that's higher than merely 1.63% of US stocks.
  • If you're looking for stocks that are quantitatively similar to TARO PHARMACEUTICAL INDUSTRIES LTD, a group of peers worth examining would be UPC, RLX, FALC, GENC, and AVGR.
  • Visit TARO's SEC page to see the company's official filings. To visit the company's web site, go to www.taro.com.

TARO Valuation Summary

  • In comparison to the median Healthcare stock, TARO's price/sales ratio is 65.96% lower, now standing at 1.6.
  • TARO's EV/EBIT ratio has moved up 8.1 over the prior 243 months.

Below are key valuation metrics over time for TARO.

Stock Date P/S P/B P/E EV/EBIT
TARO 2023-03-24 1.6 0.5 14.1 11.3
TARO 2023-03-23 1.6 0.5 13.9 11.1
TARO 2023-03-22 1.7 0.6 14.5 11.7
TARO 2023-03-21 1.7 0.6 15.1 12.3
TARO 2023-03-20 1.7 0.6 15.0 12.2
TARO 2023-03-17 1.7 0.6 15.0 12.2

TARO Growth Metrics

    Its year over year net income to common stockholders growth rate is now at 115.07%.
  • Its 2 year net income to common stockholders growth rate is now at -76.14%.
  • Its 2 year net cashflow from operations growth rate is now at -158.43%.
TARO's revenue has moved down $80,339,000 over the prior 33 months.

The table below shows TARO's growth in key financial areas (numbers in millions of US dollars).

Date Revenue Operating Cash Flow Net Income to Common Stock
2022-09-30 569.411 -188.342 64.983
2022-06-30 570.899 -260.719 91.113
2022-03-31 561.347 -158.698 58.266
2022-03-31 561.347 -158.698 58.267
2021-12-31 566.431 -148.901 1.077
2021-09-30 567.592 85.894 7.683

TARO's Quality Factors

The “Quality” component of the POWR Ratings focuses on 31 different factors of a companies fundamentals and operational strength. Here are some key insights as we drill into the specifics of these quality attributes.
  • TARO has a Quality Grade of B, ranking ahead of 81% of graded US stocks.
  • TARO's asset turnover comes in at 0.239 -- ranking 182nd of 682 Pharmaceutical Products stocks.
  • ELTP, ADMP, and ENTA are the stocks whose asset turnover ratios are most correlated with TARO.

The table below shows TARO's key quality metrics over time.

Period Asset Turnover Gross Margin ROIC
2021-09-30 0.239 0.511 -0.005
2021-06-30 0.243 0.535 0.011
2021-03-31 0.231 0.540 -0.326
2021-03-31 0.231 0.540 -0.310
2020-12-31 0.244 0.559 -0.238
2020-09-30 0.249 0.588 -0.202

TARO Stock Price Chart Interactive Chart >

Price chart for TARO

TARO Price/Volume Stats
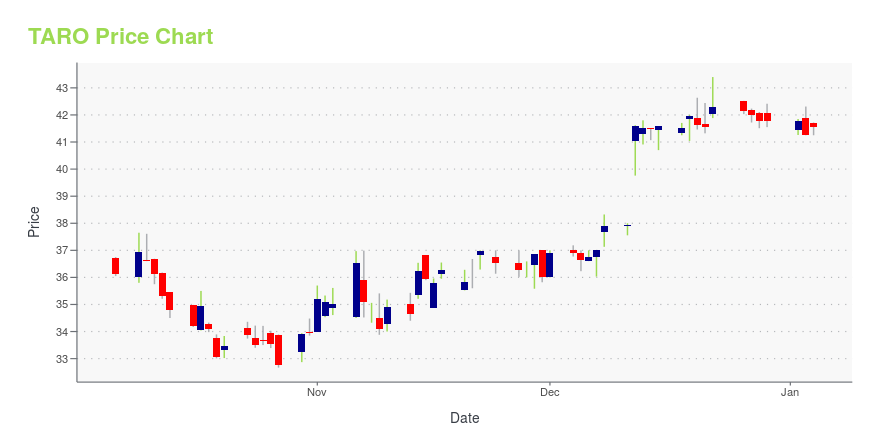
Current price $24.00 52-week high $44.84
Prev. close $23.30 52-week low $22.89
Day low $23.04 Volume 11,201
Day high $24.16 Avg. volume 13,050
50-day MA $29.11 Dividend yield N/A
200-day MA $31.51 Market Cap 902.04M

Taro Pharmaceutical Industries Ltd. (TARO) Company Bio


Taro Pharmaceutical Industries offers prescription and over-the-counter pharmaceutical products focusing on primary areas, including topical creams and ointments, liquids, capsules, and tablets in the dermatological and topical, cardiovascular, neuropsychiatric, and anti-inflammatory therapeutic categories. The company was founded in 1959 and is based in Haifa Bay, Israel.


TARO Latest News Stream


Event/Time News Detail
Loading, please wait...

TARO Latest Social Stream


Loading social stream, please wait...

View Full TARO Social Stream

Latest TARO News From Around the Web

Below are the latest news stories about TARO PHARMACEUTICAL INDUSTRIES LTD that investors may wish to consider to help them evaluate TARO as an investment opportunity.

Taro Pharmaceutical Industries Third Quarter 2023 Earnings: Misses Expectations

Taro Pharmaceutical Industries ( NYSE:TARO ) Third Quarter 2023 Results Key Financial Results Revenue: US$139.2m (flat...

Yahoo | January 27, 2023

Taro Provides Results for December 31, 2022

HAWTHORNE, N.Y., January 24, 2023--TARO PROVIDES RESULTS FOR DECEMBER 31, 2022

Yahoo | January 24, 2023

Taro to Release Third Quarter Results on January 24, 2023

HAWTHORNE, N.Y., January 19, 2023--TARO TO RELEASE THIRD QUARTER RESULTS ON JANUARY 24, 2023

Yahoo | January 19, 2023

Taro Pharmaceutical (TARO) Reports Q2 Loss, Misses Revenue Estimates

Taro (TARO) delivered earnings and revenue surprises of -108.33% and 18.96%, respectively, for the quarter ended September 2022. Do the numbers hold clues to what lies ahead for the stock?

Yahoo | October 27, 2022

Taro Provides Results for September 30, 2022

HAWTHORNE, N.Y., October 27, 2022--TARO PROVIDES RESULTS FOR SEPTEMBER 30, 2022

Yahoo | October 27, 2022

Read More 'TARO' Stories Here

TARO Price Returns

1-mo -20.58%
3-mo -17.36%
6-mo -19.95%
1-year -44.34%
3-year -61.59%
5-year -75.69%
YTD -17.36%
2022 -42.05%
2021 -31.75%
2020 -16.50%
2019 3.89%
2018 -19.17%

Get Free Updates

Join thousands of investors who get the latest news, insights and top rated picks from StockNews.com!


Page generated in 0.897 seconds.