Taylor Devices, Inc. (TAYD): Price and Financial Metrics
TAYD Price/Volume Stats
Current price | $23.09 | 52-week high | $26.40 |
Prev. close | $22.65 | 52-week low | $10.50 |
Day low | $22.52 | Volume | 6,700 |
Day high | $23.09 | Avg. volume | 10,997 |
50-day MA | $22.09 | Dividend yield | N/A |
200-day MA | $21.21 | Market Cap | 81.30M |
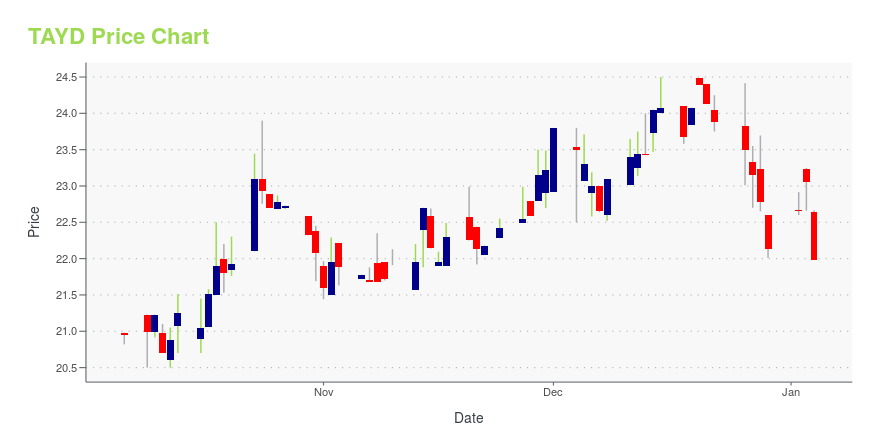
TAYD Stock Price Chart Interactive Chart >
TAYD POWR Grades
- Momentum is the dimension where TAYD ranks best; there it ranks ahead of 98.68% of US stocks.
- The strongest trend for TAYD is in Growth, which has been heading down over the past 177 days.
- TAYD ranks lowest in Stability; there it ranks in the 68th percentile.
TAYD Stock Summary
- The ratio of debt to operating expenses for TAYLOR DEVICES INC is higher than it is for about merely 0.22% of US stocks.
- Equity multiplier, or assets relative to shareholders' equity, comes in at 1.14 for TAYLOR DEVICES INC; that's greater than it is for just 10.81% of US stocks.
- In terms of twelve month growth in earnings before interest and taxes, TAYLOR DEVICES INC is reporting a growth rate of 119.29%; that's higher than 90.87% of US stocks.
- If you're looking for stocks that are quantitatively similar to TAYLOR DEVICES INC, a group of peers worth examining would be TNC, RKDA, SWBI, REZI, and PWFL.
- Visit TAYD's SEC page to see the company's official filings. To visit the company's web site, go to www.taylordevices.com.
TAYD Valuation Summary
- In comparison to the median Industrials stock, TAYD's price/sales ratio is 8.57% higher, now standing at 1.9.
- Over the past 243 months, TAYD's price/earnings ratio has gone up 45.
Below are key valuation metrics over time for TAYD.
Stock | Date | P/S | P/B | P/E | EV/EBIT |
---|---|---|---|---|---|
TAYD | 2023-11-09 | 1.9 | 1.5 | 10.7 | 9.4 |
TAYD | 2023-11-08 | 1.9 | 1.5 | 10.7 | 9.3 |
TAYD | 2023-11-07 | 1.9 | 1.5 | 10.7 | 9.3 |
TAYD | 2023-11-06 | 1.9 | 1.5 | 10.8 | 9.4 |
TAYD | 2023-11-03 | 1.9 | 1.5 | 10.8 | 9.4 |
TAYD | 2023-11-02 | 1.9 | 1.5 | 10.8 | 9.5 |
TAYD Growth Metrics
- Its 2 year net income to common stockholders growth rate is now at -74.19%.
- Its 4 year net income to common stockholders growth rate is now at 17.77%.
- Its 3 year price growth rate is now at -18.72%.

The table below shows TAYD's growth in key financial areas (numbers in millions of US dollars).
Date | Revenue | Operating Cash Flow | Net Income to Common Stock |
---|---|---|---|
2022-12-31 | 35.38892 | 4.534304 | 3.959621 |
2022-09-30 | 32.64954 | 3.248439 | 3.059917 |
2022-06-30 | 30.86658 | 3.308525 | 2.239423 |
2022-03-31 | 28.46927 | 5.393261 | 0.783664 |
2021-12-31 | 27.09831 | 5.094036 | 1.083275 |
2021-09-30 | 24.05792 | 6.55223 | 1.068761 |
Latest TAYD News From Around the Web
Below are the latest news stories about TAYLOR DEVICES INC that investors may wish to consider to help them evaluate TAYD as an investment opportunity.
TAYLOR DEVICES ANNOUNCES FIRST QUARTER RESULTSTaylor Devices, Inc. (NASDAQ SmallCap: "TAYD") announced today that it had first quarter sales of $9,923,628, up slightly from last year's first quarter sales of $9,090,699. |
We Ran A Stock Scan For Earnings Growth And Taylor Devices (NASDAQ:TAYD) Passed With EaseThe excitement of investing in a company that can reverse its fortunes is a big draw for some speculators, so even... |
Is Taylor Devices, Inc.'s (NASDAQ:TAYD) Recent Stock Performance Tethered To Its Strong Fundamentals?Taylor Devices' (NASDAQ:TAYD) stock is up by a considerable 16% over the past three months. Since the market usually... |
TAYLOR DEVICES ANNOUNCES STRONG FOURTH QUARTER AND RECORD FULL YEAR RESULTSTaylor Devices, Inc. (NASDAQ SmallCap: "TAYD") announced today that it had 4th quarter sales of $10,720,017, up from last year's 4th quarter sales of $9,657,530. Sales for the full year of $40,199,354 were significantly up from last year's level of $30,866,582. |
Investors in Taylor Devices (NASDAQ:TAYD) have seen stellar returns of 172% over the past yearTaylor Devices, Inc. ( NASDAQ:TAYD ) shareholders might be concerned after seeing the share price drop 11% in the last... |
TAYD Price Returns
1-mo | 5.39% |
3-mo | 7.45% |
6-mo | 7.90% |
1-year | N/A |
3-year | 133.94% |
5-year | 83.98% |
YTD | 62.72% |
2022 | N/A |
2021 | 0.00% |
2020 | -0.38% |
2019 | -13.71% |
2018 | -9.24% |
Continue Researching TAYD
Here are a few links from around the web to help you further your research on Taylor Devices Inc's stock as an investment opportunity:Taylor Devices Inc (TAYD) Stock Price | Nasdaq
Taylor Devices Inc (TAYD) Stock Quote, History and News - Yahoo Finance
Taylor Devices Inc (TAYD) Stock Price and Basic Information | MarketWatch
Loading social stream, please wait...