The Bancorp, Inc. (TBBK): Price and Financial Metrics
GET POWR RATINGS... FREE!
TBBK POWR Grades
- Growth is the dimension where TBBK ranks best; there it ranks ahead of 86.48% of US stocks.
- TBBK's strongest trending metric is Momentum; it's been moving down over the last 179 days.
- TBBK's current lowest rank is in the Value metric (where it is better than 13.94% of US stocks).
TBBK Stock Summary
- TBBK's price/sales ratio is 4.57; that's higher than the P/S ratio of 77.08% of US stocks.
- TBBK's equity multiplier -- a measure of assets relative to shareholders'equity -- is greater than that of 92.59% of US stocks.
- With a year-over-year growth in debt of -19.21%, BANCORP INC's debt growth rate surpasses only 15.27% of about US stocks.
- If you're looking for stocks that are quantitatively similar to BANCORP INC, a group of peers worth examining would be NECB, HTBK, OPHC, SAL, and SSB.
- Visit TBBK's SEC page to see the company's official filings. To visit the company's web site, go to www.thebancorp.com.
TBBK Valuation Summary
- TBBK's EV/EBIT ratio is 5; this is 54.13% lower than that of the median Financial Services stock.
- Over the past 222 months, TBBK's price/earnings ratio has gone down 64.3.
Below are key valuation metrics over time for TBBK.
Stock | Date | P/S | P/B | P/E | EV/EBIT |
---|---|---|---|---|---|
TBBK | 2023-03-17 | 4.8 | 2.4 | 12.8 | 5.0 |
TBBK | 2023-03-16 | 5.1 | 2.6 | 13.7 | 5.7 |
TBBK | 2023-03-15 | 4.8 | 2.4 | 12.8 | 5.1 |
TBBK | 2023-03-14 | 4.8 | 2.4 | 12.9 | 5.1 |
TBBK | 2023-03-13 | 4.2 | 2.1 | 11.1 | 3.8 |
TBBK | 2023-03-10 | 4.9 | 2.4 | 13.0 | 5.2 |
TBBK Growth Metrics
- Its year over year price growth rate is now at -21.72%.
- The year over year revenue growth rate now stands at 6.03%.
- Its 3 year cash and equivalents growth rate is now at -7.16%.

The table below shows TBBK's growth in key financial areas (numbers in millions of US dollars).
Date | Revenue | Operating Cash Flow | Net Income to Common Stock |
---|---|---|---|
2022-09-30 | 326.45 | 80.808 | 116.964 |
2022-06-30 | 315.055 | -33.15 | 114.621 |
2022-03-31 | 311.964 | 51.986 | 113.654 |
2021-12-31 | 312.515 | 83.892 | 110.653 |
2021-09-30 | 308.217 | 142.464 | 107.832 |
2021-06-30 | 305.4 | 199.124 | 102.825 |
TBBK's Quality Factors
The “Quality” component of the POWR Ratings focuses on 31 different factors of a companies fundamentals and operational strength. Here are some key insights as we drill into the specifics of these quality attributes.- TBBK has a Quality Grade of C, ranking ahead of 53.61% of graded US stocks.
- TBBK's asset turnover comes in at 0.046 -- ranking 106th of 430 Banking stocks.
- ATAX, CHMG, and FHN are the stocks whose asset turnover ratios are most correlated with TBBK.
The table below shows TBBK's key quality metrics over time.
Period | Asset Turnover | Gross Margin | ROIC |
---|---|---|---|
2021-06-30 | 0.046 | 1 | 0.022 |
2021-03-31 | 0.045 | 1 | 0.020 |
2020-12-31 | 0.045 | 1 | 0.018 |
2020-09-30 | 0.043 | 1 | 0.013 |
2020-06-30 | 0.045 | 1 | 0.014 |
2020-03-31 | 0.045 | 1 | 0.014 |
TBBK Price Target
For more insight on analysts targets of TBBK, see our TBBK price target page. And for a list of of all stocks sorted by upside potential based on analyst target price, see our Top Price Target page.
Average Price Target | $28.50 | Average Broker Recommendation | 1.25 (Strong Buy) |
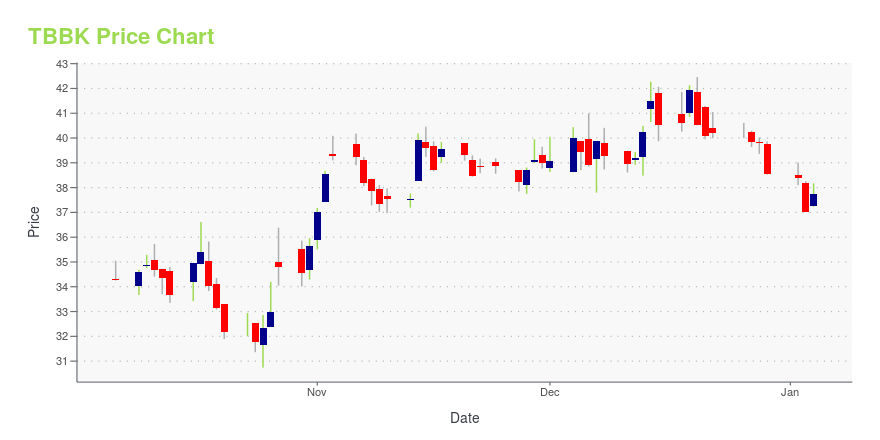
TBBK Stock Price Chart Interactive Chart >
TBBK Price/Volume Stats
Current price | $28.21 | 52-week high | $37.58 |
Prev. close | $27.62 | 52-week low | $16.59 |
Day low | $27.01 | Volume | 501,300 |
Day high | $28.44 | Avg. volume | 406,719 |
50-day MA | $32.46 | Dividend yield | N/A |
200-day MA | $26.76 | Market Cap | 1.57B |
The Bancorp, Inc. (TBBK) Company Bio
The Bancorp, Inc. operates as the financial holding company for The Bancorp Bank that provides banking products and services to individuals, and small and mid-size businesses in the United States. The company was founded in 1999 and is based in Wilmington, Delaware.
Latest TBBK News From Around the Web
Below are the latest news stories about BANCORP INC that investors may wish to consider to help them evaluate TBBK as an investment opportunity.
With 61% ownership of the shares, HarborOne Bancorp, Inc. (NASDAQ:HONE) is heavily dominated by institutional ownersKey Insights Significantly high institutional ownership implies HarborOne Bancorp's stock price is sensitive to their... |
Customers Bancorp (CUBI) Moves 10.8% Higher: Will This Strength Last?Customers Bancorp (CUBI) was a big mover last session on higher-than-average trading volume. The latest trend in earnings estimate revisions might not help the stock continue moving higher in the near term. |
Strength Seen in The Bancorp (TBBK): Can Its 16.0% Jump Turn into More Strength?The Bancorp (TBBK) witnessed a jump in share price last session on above-average trading volume. The latest trend in earnings estimate revisions for the stock doesn't suggest further strength down the road. |
Catalyst Bancorp (NASDAQ:CLST) shareholders have endured a 11% loss from investing in the stock a year agoPassive investing in an index fund is a good way to ensure your own returns roughly match the overall market. While... |
Best Momentum Stocks to Buy for March 13thPLYA, TBBK and ASBFY made it to the Zacks Rank #1 (Strong Buy) momentum stocks list on March 13, 2023. |
TBBK Price Returns
1-mo | -17.32% |
3-mo | -2.62% |
6-mo | 26.84% |
1-year | -6.19% |
3-year | 421.44% |
5-year | 159.76% |
YTD | -0.60% |
2022 | 12.13% |
2021 | 85.42% |
2020 | 5.24% |
2019 | 62.94% |
2018 | -19.43% |
Continue Researching TBBK
Want to see what other sources are saying about Bancorp Inc's financials and stock price? Try the links below:Bancorp Inc (TBBK) Stock Price | Nasdaq
Bancorp Inc (TBBK) Stock Quote, History and News - Yahoo Finance
Bancorp Inc (TBBK) Stock Price and Basic Information | MarketWatch
Loading social stream, please wait...