Tactile Systems Technology, Inc. (TCMD): Price and Financial Metrics
TCMD Price/Volume Stats
Current price | $15.84 | 52-week high | $26.11 |
Prev. close | $16.75 | 52-week low | $9.69 |
Day low | $15.83 | Volume | 273,100 |
Day high | $16.75 | Avg. volume | 330,791 |
50-day MA | $15.02 | Dividend yield | N/A |
200-day MA | $16.61 | Market Cap | 373.84M |
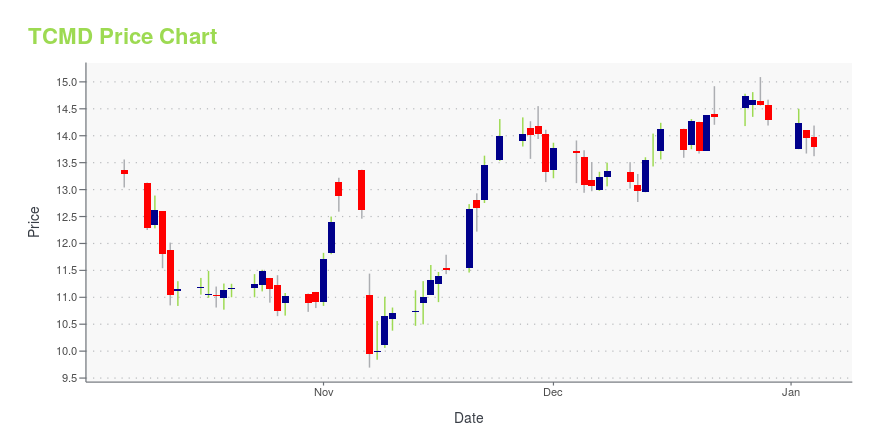
TCMD Stock Price Chart Interactive Chart >
TCMD POWR Grades
- Value is the dimension where TCMD ranks best; there it ranks ahead of 97.15% of US stocks.
- TCMD's strongest trending metric is Growth; it's been moving down over the last 26 weeks.
- TCMD ranks lowest in Momentum; there it ranks in the 4th percentile.
TCMD Stock Summary
- Of note is the ratio of TACTILE SYSTEMS TECHNOLOGY INC's sales and general administrative expense to its total operating expenses; 79% of US stocks have a lower such ratio.
- In terms of twelve month growth in earnings before interest and taxes, TACTILE SYSTEMS TECHNOLOGY INC is reporting a growth rate of -157.44%; that's higher than merely 8.66% of US stocks.
- In terms of volatility of its share price, TCMD is more volatile than 81.83% of stocks we're observing.
- Stocks that are quantitatively similar to TCMD, based on their financial statements, market capitalization, and price volatility, are TRT, PRPL, HSII, NAOV, and AQB.
- Visit TCMD's SEC page to see the company's official filings. To visit the company's web site, go to www.tactilemedical.com.
TCMD Valuation Summary
- TCMD's price/sales ratio is 1.2; this is 45.45% lower than that of the median Healthcare stock.
- Over the past 90 months, TCMD's price/sales ratio has gone down 1.4.
Below are key valuation metrics over time for TCMD.
Stock | Date | P/S | P/B | P/E | EV/EBIT |
---|---|---|---|---|---|
TCMD | 2023-12-29 | 1.2 | 1.8 | 13.5 | 31.0 |
TCMD | 2023-12-28 | 1.3 | 1.9 | 13.7 | 31.6 |
TCMD | 2023-12-27 | 1.3 | 1.9 | 13.8 | 31.8 |
TCMD | 2023-12-26 | 1.3 | 1.9 | 13.9 | 31.9 |
TCMD | 2023-12-22 | 1.2 | 1.8 | 13.5 | 31.1 |
TCMD | 2023-12-21 | 1.2 | 1.8 | 13.6 | 31.2 |
TCMD Growth Metrics
- Its 5 year price growth rate is now at 151.24%.
- Its year over year revenue growth rate is now at 14.52%.
- Its 2 year net income to common stockholders growth rate is now at -406.56%.
The table below shows TCMD's growth in key financial areas (numbers in millions of US dollars).
Date | Revenue | Operating Cash Flow | Net Income to Common Stock |
---|---|---|---|
2022-12-31 | 246.785 | 5.209 | -17.866 |
2022-09-30 | 234.613 | 6.96 | -29.982 |
2022-06-30 | 221.848 | 3.648 | -31.058 |
2022-03-31 | 213.263 | 0.225 | -25.113 |
2021-12-31 | 208.057 | 2.631 | -11.811 |
2021-09-30 | 205.572 | 2.064 | 7.797 |
TCMD's Quality Factors
The “Quality” component of the POWR Ratings focuses on 31 different factors of a companies fundamentals and operational strength. Here are some key insights as we drill into the specifics of these quality attributes.- TCMD has a Quality Grade of C, ranking ahead of 74.53% of graded US stocks.
- TCMD's asset turnover comes in at 1.174 -- ranking 16th of 186 Medical Equipment stocks.
- BIOL, XENT, and NUVA are the stocks whose asset turnover ratios are most correlated with TCMD.
The table below shows TCMD's key quality metrics over time.
Period | Asset Turnover | Gross Margin | ROIC |
---|---|---|---|
2021-06-30 | 1.174 | 0.709 | 0.048 |
2021-03-31 | 1.148 | 0.709 | -0.019 |
2020-12-31 | 1.190 | 0.710 | -0.020 |
2020-09-30 | 1.220 | 0.714 | -0.038 |
2020-06-30 | 1.252 | 0.714 | -0.023 |
2020-03-31 | 1.365 | 0.711 | 0.083 |
TCMD Price Target
For more insight on analysts targets of TCMD, see our TCMD price target page. And for a list of of all stocks sorted by upside potential based on analyst target price, see our Top Price Target page.
Average Price Target | $70.00 | Average Broker Recommendation | 1.1 (Strong Buy) |
Tactile Systems Technology, Inc. (TCMD) Company Bio
Tactile Systems Technology, Inc., a medical technology company, develops and provides medical devices for the treatment of chronic diseases in the United States. The company was founded in 1995 and is based in Minneapolis, Minnesota.
Latest TCMD News From Around the Web
Below are the latest news stories about TACTILE SYSTEMS TECHNOLOGY INC that investors may wish to consider to help them evaluate TCMD as an investment opportunity.
Tactile Systems Technology (NASDAQ:TCMD) investors are sitting on a loss of 67% if they invested three years agoInvesting in stocks inevitably means buying into some companies that perform poorly. But long term Tactile Systems... |
At US$13.68, Is It Time To Put Tactile Systems Technology, Inc. (NASDAQ:TCMD) On Your Watch List?Tactile Systems Technology, Inc. ( NASDAQ:TCMD ), might not be a large cap stock, but it led the NASDAQGM gainers with... |
Declining Stock and Decent Financials: Is The Market Wrong About Tactile Systems Technology, Inc. (NASDAQ:TCMD)?Tactile Systems Technology (NASDAQ:TCMD) has had a rough three months with its share price down 36%. However, stock... |
LifeLens Technologies Expands Executive Leadership Team and Board of DirectorsPHILADELPHIA, Nov. 08, 2023 (GLOBE NEWSWIRE) -- LifeLens Technologies, Inc. (LifeLens), a medical technology company that provides real-time physiological monitoring, today announced the appointment of three industry veterans to the following positions on its executive leadership team and Board of Directors: Daniel J. Sullivan, Chairman of the Board of LifeLens, as Chief Executive OfficerBrent A. Moen as Chief Financial OfficerRichard J. Buchholz as a member of the Board of Directors “With LifeL |
Tactile Systems Technology, Inc. (NASDAQ:TCMD) Q3 2023 Earnings Call TranscriptTactile Systems Technology, Inc. (NASDAQ:TCMD) Q3 2023 Earnings Call Transcript November 6, 2023 Tactile Systems Technology, Inc. beats earnings expectations. Reported EPS is $0.94, expectations were $0.03. Operator: Welcome ladies and gentlemen to the Third Quarter of Fiscal Year 2023 Earnings Conference Call for Tactile Medical. At this time all participants have been placed in […] |
TCMD Price Returns
1-mo | 7.98% |
3-mo | 11.00% |
6-mo | 15.87% |
1-year | 9.24% |
3-year | -70.24% |
5-year | -73.64% |
YTD | 10.77% |
2023 | 24.56% |
2022 | -39.67% |
2021 | -57.65% |
2020 | -33.43% |
2019 | 48.21% |
Continue Researching TCMD
Here are a few links from around the web to help you further your research on Tactile Systems Technology Inc's stock as an investment opportunity:Tactile Systems Technology Inc (TCMD) Stock Price | Nasdaq
Tactile Systems Technology Inc (TCMD) Stock Quote, History and News - Yahoo Finance
Tactile Systems Technology Inc (TCMD) Stock Price and Basic Information | MarketWatch
Loading social stream, please wait...