TRACON Pharmaceuticals, Inc. (TCON): Price and Financial Metrics
TCON Price/Volume Stats
Current price | $0.42 | 52-week high | $2.19 |
Prev. close | $0.41 | 52-week low | $0.13 |
Day low | $0.40 | Volume | 519,052 |
Day high | $0.43 | Avg. volume | 2,951,699 |
50-day MA | $0.25 | Dividend yield | N/A |
200-day MA | $0.24 | Market Cap | 19.11M |
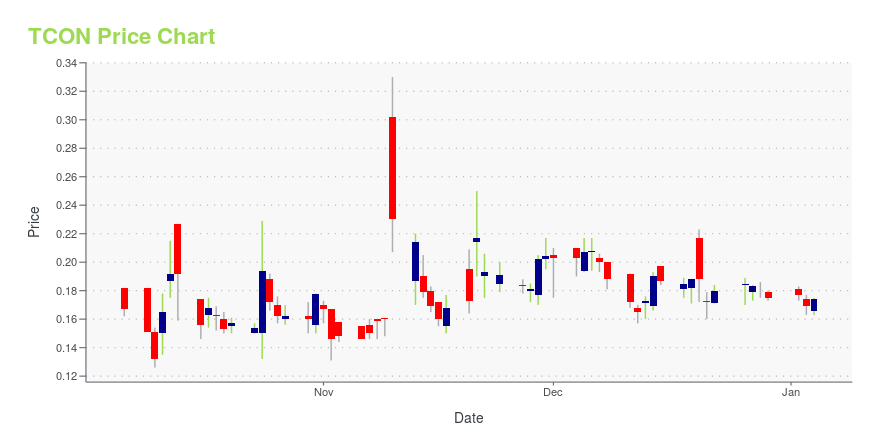
TCON Stock Price Chart Interactive Chart >
TCON Stock Summary
- The ratio of debt to operating expenses for TRACON PHARMACEUTICALS INC is higher than it is for about just 0.22% of US stocks.
- With a year-over-year growth in debt of -100%, TRACON PHARMACEUTICALS INC's debt growth rate surpasses merely 0% of about US stocks.
- TRACON PHARMACEUTICALS INC's shareholder yield -- a measure of how much capital is returned to stockholders via dividends and buybacks -- is 169.43%, greater than the shareholder yield of 98.73% of stocks in our set.
- Stocks with similar financial metrics, market capitalization, and price volatility to TRACON PHARMACEUTICALS INC are SRZN, SENS, SABS, ABEO, and ADVM.
- Visit TCON's SEC page to see the company's official filings. To visit the company's web site, go to www.traconpharma.com.
TCON Valuation Summary
- In comparison to the median Healthcare stock, TCON's EV/EBIT ratio is 94.52% lower, now standing at 0.8.
- Over the past 108 months, TCON's price/earnings ratio has gone up 15.3.
Below are key valuation metrics over time for TCON.
Stock | Date | P/S | P/B | P/E | EV/EBIT |
---|---|---|---|---|---|
TCON | 2023-12-29 | 0.6 | -1.8 | -0.5 | 0.8 |
TCON | 2023-12-28 | 0.6 | -1.8 | -0.5 | 0.8 |
TCON | 2023-12-27 | 0.6 | -1.8 | -0.5 | 0.8 |
TCON | 2023-12-26 | 0.6 | -1.9 | -0.5 | 0.7 |
TCON | 2023-12-22 | 0.6 | -1.8 | -0.5 | 0.8 |
TCON | 2023-12-21 | 0.6 | -1.8 | -0.5 | 0.9 |
TCON Growth Metrics
- Its 4 year price growth rate is now at -93.08%.
- Its 2 year net income to common stockholders growth rate is now at -69.78%.
- The 2 year net cashflow from operations growth rate now stands at -11.71%.
The table below shows TCON's growth in key financial areas (numbers in millions of US dollars).
Date | Revenue | Operating Cash Flow | Net Income to Common Stock |
---|---|---|---|
2022-09-30 | 0 | -26.7 | -29.85 |
2022-06-30 | 0 | -28.297 | -30.367 |
2022-03-31 | 0.346 | -24.454 | -33.076 |
2021-12-31 | 0.346 | -22.571 | -28.667 |
2021-09-30 | 0.346 | -21.083 | -25.266 |
2021-06-30 | 0.346 | -16.928 | -22.306 |
TCON's Quality Factors
The “Quality” component of the POWR Ratings focuses on 31 different factors of a companies fundamentals and operational strength. Here are some key insights as we drill into the specifics of these quality attributes.- TCON has a Quality Grade of C, ranking ahead of 39.83% of graded US stocks.
- TCON's asset turnover comes in at 0.011 -- ranking 386th of 681 Pharmaceutical Products stocks.
- ATXS, PTCT, and ZIOP are the stocks whose asset turnover ratios are most correlated with TCON.
The table below shows TCON's key quality metrics over time.
Period | Asset Turnover | Gross Margin | ROIC |
---|---|---|---|
2021-06-30 | 0.011 | 1 | 5.011 |
2021-03-31 | 0.000 | NA | 6.881 |
2020-12-31 | 0.000 | NA | 5.950 |
2020-09-30 | 0.000 | NA | 4.354 |
2020-06-30 | 0.000 | NA | 4.418 |
2020-03-31 | 0.000 | NA | 4.304 |
TCON Price Target
For more insight on analysts targets of TCON, see our TCON price target page. And for a list of of all stocks sorted by upside potential based on analyst target price, see our Top Price Target page.
Average Price Target | $14.75 | Average Broker Recommendation | 1.43 (Moderate Buy) |
TRACON Pharmaceuticals, Inc. (TCON) Company Bio
Tracon Pharmaceuticals develops targeted therapies for cancer, wet age-related macular degeneration and fibrotic diseases. The company was founded in 2004 and is based in San Diego, California.
Latest TCON News From Around the Web
Below are the latest news stories about TRACON PHARMACEUTICALS INC that investors may wish to consider to help them evaluate TCON as an investment opportunity.
Why Is Tracon Pharmaceuticals (TCON) Stock Up 19% Today?Tracon Pharmaceuticals stock is rising higher on Tuesday as investors in TCON react to news of a new licensing agreement. |
Why Is LQR House (LQR) Stock Up 30% Today?LQR House stock is rising higher on Tuesday after the company announced plans to repurchase up to $2 million worth of its shares. |
Why Is Reliance Global (RELI) Stock on the Move Today?Reliance Global stock is on the move Tuesday after the company first announced, and then withdrew, a public offering for RELI shares. |
Today’s Biggest Pre-Market Stock Movers: 10 Top Gainers and Losers on TuesdayIt's time to start Tuesday trading with a breakdown of the biggest pre-market stock movers worth keeping an eye on this morning! |
TRACON Pharmaceuticals Announces License of Product Development Platform for $3.0 Million Upfront PaymentSAN DIEGO, Nov. 20, 2023 (GLOBE NEWSWIRE) -- TRACON Pharmaceuticals, Inc. (Nasdaq: TCON), a clinical stage biopharmaceutical company utilizing a cost-efficient, CRO-independent product development platform (PDP) to advance its pipeline of novel targeted cancer therapeutics and to partner with other life science companies, today announced it has licensed its proprietary PDP of CRO-independent clinical research to a clinical stage biotech company for a $3.0 million upfront payment. “We are excited |
TCON Price Returns
1-mo | 136.09% |
3-mo | 139.86% |
6-mo | 135.96% |
1-year | -79.31% |
3-year | -94.44% |
5-year | -96.93% |
YTD | 139.86% |
2023 | -88.25% |
2022 | -46.21% |
2021 | -76.32% |
2020 | 400.00% |
2019 | -62.86% |
Loading social stream, please wait...