Teradata Corporation (TDC): Price and Financial Metrics
GET POWR RATINGS... FREE!
TDC POWR Grades
- Quality is the dimension where TDC ranks best; there it ranks ahead of 97.59% of US stocks.
- The strongest trend for TDC is in Sentiment, which has been heading up over the past 178 days.
- TDC ranks lowest in Momentum; there it ranks in the 28th percentile.
TDC Stock Summary
- TERADATA CORP's capital turnover -- a measure of revenue relative to shareholder's equity -- is better than 94.17% of US listed stocks.
- TDC's current price/earnings ratio is 115.61, which is higher than 95.78% of US stocks with positive earnings.
- Equity multiplier, or assets relative to shareholders' equity, comes in at 8.01 for TERADATA CORP; that's greater than it is for 86.5% of US stocks.
- Stocks that are quantitatively similar to TDC, based on their financial statements, market capitalization, and price volatility, are FLNC, NTAP, NSTG, OOMA, and KLTR.
- TDC's SEC filings can be seen here. And to visit TERADATA CORP's official web site, go to www.teradata.com.
TDC Valuation Summary
- In comparison to the median Technology stock, TDC's price/sales ratio is 12.5% lower, now standing at 2.1.
- TDC's price/sales ratio has moved down 1 over the prior 188 months.
Below are key valuation metrics over time for TDC.
Stock | Date | P/S | P/B | P/E | EV/EBIT |
---|---|---|---|---|---|
TDC | 2023-03-14 | 2.1 | 14.7 | 115.2 | 42.5 |
TDC | 2023-03-13 | 2.1 | 14.5 | 113.0 | 41.7 |
TDC | 2023-03-10 | 2.1 | 14.8 | 115.4 | 42.6 |
TDC | 2023-03-09 | 2.2 | 15.2 | 118.5 | 43.7 |
TDC | 2023-03-08 | 2.2 | 15.6 | 122.0 | 45.0 |
TDC | 2023-03-07 | 2.2 | 15.5 | 121.4 | 44.8 |
TDC Growth Metrics
- The year over year cash and equivalents growth rate now stands at -24.91%.
- The 2 year net income to common stockholders growth rate now stands at -17.72%.
- The 2 year cash and equivalents growth rate now stands at 2.54%.

The table below shows TDC's growth in key financial areas (numbers in millions of US dollars).
Date | Revenue | Operating Cash Flow | Net Income to Common Stock |
---|---|---|---|
2022-12-31 | 1,795 | 419 | 33 |
2022-09-30 | 1,818 | 385 | 73 |
2022-06-30 | 1,861 | 384 | 82 |
2022-03-31 | 1,922 | 504 | 130 |
2021-12-31 | 1,917 | 463 | 147 |
2021-09-30 | 1,933 | 424 | 119 |
TDC's Quality Factors
The “Quality” component of the POWR Ratings focuses on 31 different factors of a companies fundamentals and operational strength. Here are some key insights as we drill into the specifics of these quality attributes.- TDC has a Quality Grade of B, ranking ahead of 94.16% of graded US stocks.
- TDC's asset turnover comes in at 0.88 -- ranking 151st of 563 Business Services stocks.
- CCO, RGP, and DLHC are the stocks whose asset turnover ratios are most correlated with TDC.
The table below shows TDC's key quality metrics over time.
Period | Asset Turnover | Gross Margin | ROIC |
---|---|---|---|
2021-06-30 | 0.880 | 0.599 | 0.185 |
2021-03-31 | 0.879 | 0.582 | 0.104 |
2020-12-31 | 0.858 | 0.555 | 0.003 |
2020-09-30 | 0.873 | 0.535 | -0.012 |
2020-06-30 | 0.890 | 0.529 | 0.004 |
2020-03-31 | 0.898 | 0.513 | 0.015 |
TDC Price Target
For more insight on analysts targets of TDC, see our TDC price target page. And for a list of of all stocks sorted by upside potential based on analyst target price, see our Top Price Target page.
Average Price Target | $57.55 | Average Broker Recommendation | 1.71 (Moderate Buy) |
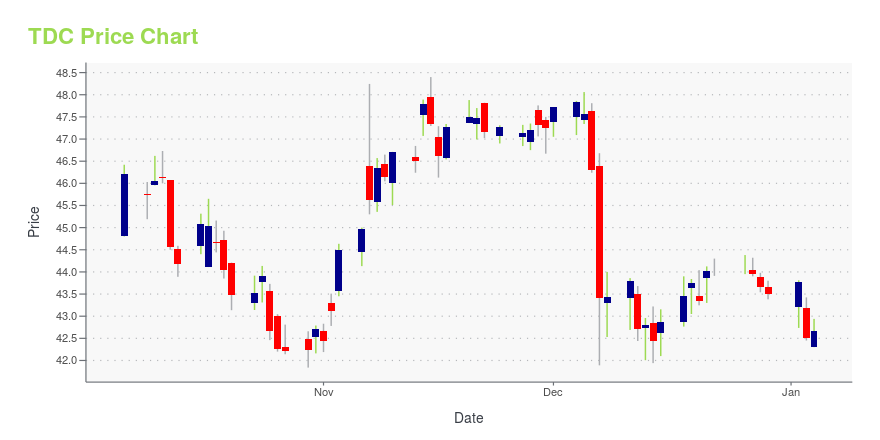
TDC Stock Price Chart Interactive Chart >
TDC Price/Volume Stats
Current price | $39.05 | 52-week high | $50.99 |
Prev. close | $38.63 | 52-week low | $28.65 |
Day low | $38.67 | Volume | 877,300 |
Day high | $39.16 | Avg. volume | 950,783 |
50-day MA | $37.15 | Dividend yield | N/A |
200-day MA | $34.83 | Market Cap | 3.94B |
Teradata Corporation (TDC) Company Bio
Teradata Corp. is the cloud data analytics company. It is built for a multi-cloud reality and solving the data challenges at scale. The company was founded on July 13, 1979 and is headquartered in San Diego, CA.
Latest TDC News From Around the Web
Below are the latest news stories about TERADATA CORP that investors may wish to consider to help them evaluate TDC as an investment opportunity.
3 Storage Devices Stocks to Look For Amid Industry WeaknessDespite macroeconomic headwinds and supply chain troubles, momentum in cloud computing, IoT, auto, connected devices, VR and AI will likely favor the prospects of the Zacks Computer - Storage Devices industry players like NTAP, PSTG and TDC. |
Why Is Teradata (TDC) Down 7.2% Since Last Earnings Report?Teradata (TDC) reported earnings 30 days ago. What's next for the stock? We take a look at earnings estimates for some clues. |
Teradata Helps Customers Unlock True Value of their Data with Integration of Teradata VantageCloud and Microsoft Azure Machine LearningSAN DIEGO, March 08, 2023--Teradata announced the integration & general availability of Teradata VantageCloud with Microsoft Azure Machine Learning. |
Here's Why Teradata (TDC) is a Strong Momentum StockThe Zacks Style Scores offers investors a way to easily find top-rated stocks based on their investing style. Here's why you should take advantage. |
Teradata Full Year 2022 Earnings: EPS Misses ExpectationsTeradata ( NYSE:TDC ) Full Year 2022 Results Key Financial Results Revenue: US$3.59b (down 6.4% from FY 2021). Net... |
TDC Price Returns
1-mo | N/A |
3-mo | 16.81% |
6-mo | 27.41% |
1-year | -20.97% |
3-year | 101.18% |
5-year | -2.13% |
YTD | 16.01% |
2022 | -20.74% |
2021 | 89.01% |
2020 | -16.06% |
2019 | -30.21% |
2018 | -0.26% |
Continue Researching TDC
Want to see what other sources are saying about Teradata Corp's financials and stock price? Try the links below:Teradata Corp (TDC) Stock Price | Nasdaq
Teradata Corp (TDC) Stock Quote, History and News - Yahoo Finance
Teradata Corp (TDC) Stock Price and Basic Information | MarketWatch
Loading social stream, please wait...