
TransDigm Group Inc. (TDG): Price and Financial Metrics
TDG Price/Volume Stats
| Current price | $1,234.86 | 52-week high | $1,369.57 |
| Prev. close | $1,228.42 | 52-week low | $802.46 |
| Day low | $1,232.63 | Volume | 207,900 |
| Day high | $1,253.19 | Avg. volume | 222,666 |
| 50-day MA | $1,295.47 | Dividend yield | N/A |
| 200-day MA | $1,132.29 | Market Cap | 69.10B |
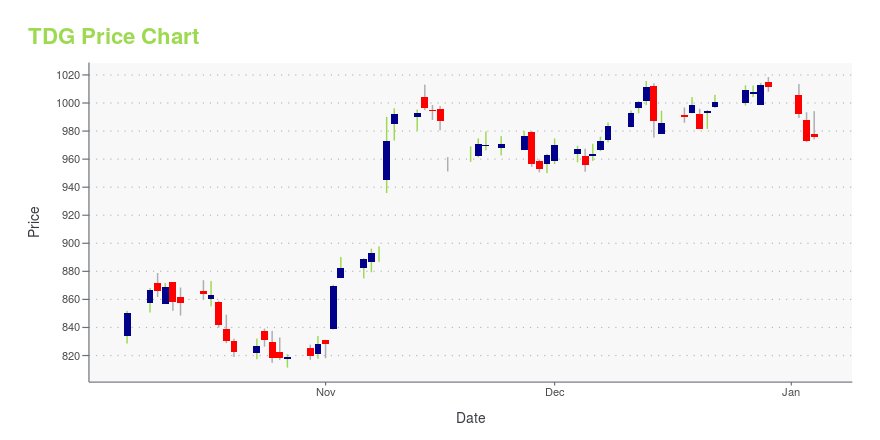
TDG Stock Price Chart Interactive Chart >
TransDigm Group Inc. (TDG) Company Bio
TransDigm Group is a publicly traded aerospace manufacturing company headquartered in Cleveland, Ohio. TransDigm develops and manufactures engineered aerospace components. It was founded in 1993, when four industrial aerospace companies were combined by a private equity firm in a leveraged buyout. TransDigm expanded the range of aerospace components it manufactures through acquisitions over the years. It filed an initial public offering on the New York Stock Exchange in 2006. (Source:Wikipedia)
Latest TDG News From Around the Web
Below are the latest news stories about TRANSDIGM GROUP INC that investors may wish to consider to help them evaluate TDG as an investment opportunity.
5 Defense Stocks That Could Keep Winning Streaks Alive in 2024Companies in the Zacks Aerospace sector, which houses the defense stocks, are expected to record annual earnings growth of 32.3% on 8.2% sales growth in 2024. You may buy ACHR, AVAV, RYCEY, TDG and TGI. |
The Zacks Analyst Blog Highlights Leidos, TransDigm, AeroVironment, Rolls Royce and SafranLeidos, TransDigm, AeroVironment, Rolls Royce and Safran are included in this Analyst Blog. |
17 High Growth Large-Cap Stocks To Invest InIn this article, we will take a detailed look at the 17 High Growth Large-Cap Stocks To Invest In. For a quick overview of such stocks, read our article 5 High Growth Large-Cap Stocks To Invest In. Market skeptics are on the back foot after the Federal Reserve’s indication that its battle against inflation is bearing fruit and its […] |
5 Aerospace Stocks That Crushed the Market in 2023As the International Air Transport Association expects air passenger revenues to mark an impressive 47% improvement in 2023 from the previous year's reported number, you can buy LDOS, TDG, AVAV, RYCEY and SAFRY. |
14 Most Profitable Industrial Stocks NowIn this piece, we will take a look at the 14 most profitable industrial stocks to buy now. If you want to skip our overview of the industrial sector and some recent developments, then take a look at 5 Most Profitable Industrial Stocks Now. The industrial sector plays a fundamental role in the U.S. economy, […] |
TDG Price Returns
| 1-mo | -4.17% |
| 3-mo | -1.93% |
| 6-mo | 14.16% |
| 1-year | 39.51% |
| 3-year | 90.41% |
| 5-year | 151.32% |
| YTD | 22.07% |
| 2023 | 60.66% |
| 2022 | -1.04% |
| 2021 | 2.82% |
| 2020 | 10.51% |
| 2019 | 64.68% |
Continue Researching TDG
Here are a few links from around the web to help you further your research on TransDigm Group INC's stock as an investment opportunity:TransDigm Group INC (TDG) Stock Price | Nasdaq
TransDigm Group INC (TDG) Stock Quote, History and News - Yahoo Finance
TransDigm Group INC (TDG) Stock Price and Basic Information | MarketWatch
Loading social stream, please wait...