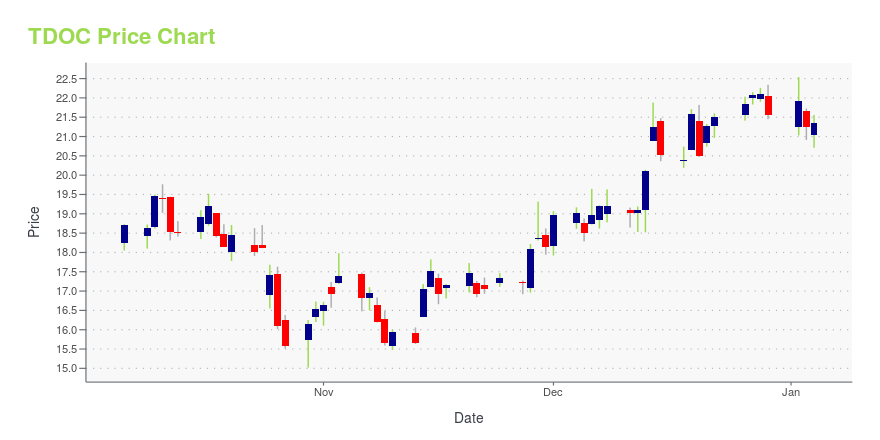
Teladoc Health Inc. (TDOC): Price and Financial Metrics
GET POWR RATINGS... FREE!
TDOC POWR Grades
- Value is the dimension where TDOC ranks best; there it ranks ahead of 35.7% of US stocks.
- TDOC's strongest trending metric is Growth; it's been moving down over the last 177 days.
- TDOC's current lowest rank is in the Sentiment metric (where it is better than 5.32% of US stocks).
TDOC Stock Summary
- Of note is the ratio of TELADOC HEALTH INC's sales and general administrative expense to its total operating expenses; merely 4.29% of US stocks have a lower such ratio.
- Equity multiplier, or assets relative to shareholders' equity, comes in at 1.21 for TELADOC HEALTH INC; that's greater than it is for merely 13.91% of US stocks.
- Over the past twelve months, TDOC has reported earnings growth of 1,270.53%, putting it ahead of 98.46% of US stocks in our set.
- If you're looking for stocks that are quantitatively similar to TELADOC HEALTH INC, a group of peers worth examining would be PTEN, MGY, EGO, CGC, and PDCE.
- Visit TDOC's SEC page to see the company's official filings. To visit the company's web site, go to www.teladochealth.com.
TDOC Valuation Summary
- In comparison to the median Technology stock, TDOC's price/sales ratio is 30.43% lower, now standing at 1.6.
- Over the past 92 months, TDOC's EV/EBIT ratio has gone up 65.6.
Below are key valuation metrics over time for TDOC.
Stock | Date | P/S | P/B | P/E | EV/EBIT |
---|---|---|---|---|---|
TDOC | 2023-01-06 | 1.6 | 0.6 | -0.4 | -0.4 |
TDOC | 2023-01-05 | 1.6 | 0.6 | -0.4 | -0.4 |
TDOC | 2023-01-04 | 1.6 | 0.6 | -0.4 | -0.5 |
TDOC | 2023-01-03 | 1.6 | 0.6 | -0.4 | -0.4 |
TDOC | 2022-12-30 | 1.6 | 0.6 | -0.4 | -0.5 |
TDOC | 2022-12-29 | 1.7 | 0.6 | -0.4 | -0.5 |
TDOC Growth Metrics
- Its year over year net cashflow from operations growth rate is now at 376.41%.
- Its year over year price growth rate is now at -77.24%.
- Its 5 year revenue growth rate is now at 335.11%.

The table below shows TDOC's growth in key financial areas (numbers in millions of US dollars).
Date | Revenue | Operating Cash Flow | Net Income to Common Stock |
---|---|---|---|
2022-09-30 | 2,323.366 | 206.951 | -9,860.445 |
2022-06-30 | 2,233.622 | 220.521 | -9,871.309 |
2022-03-31 | 2,144.382 | 180.269 | -6,903.667 |
2021-12-31 | 2,032.707 | 193.99 | -428.793 |
2021-09-30 | 1,861.793 | -4.154 | -811.775 |
2021-06-30 | 1,628.947 | -48.55 | -763.319 |
TDOC's Quality Factors
The “Quality” component of the POWR Ratings focuses on 31 different factors of a companies fundamentals and operational strength. Here are some key insights as we drill into the specifics of these quality attributes.- TDOC has a Quality Grade of D, ranking ahead of 14.45% of graded US stocks.
- TDOC's asset turnover comes in at 0.105 -- ranking 74th of 81 Healthcare stocks.
- LH, UHS, and FLGT are the stocks whose asset turnover ratios are most correlated with TDOC.
The table below shows TDOC's key quality metrics over time.
Period | Asset Turnover | Gross Margin | ROIC |
---|---|---|---|
2021-09-30 | 0.105 | 0.679 | -0.486 |
2021-06-30 | 0.116 | 0.672 | -0.492 |
2021-03-31 | 0.133 | 0.660 | -0.455 |
2020-12-31 | 0.173 | 0.643 | -0.503 |
2020-09-30 | 0.382 | 0.627 | -0.096 |
2020-06-30 | 0.398 | 0.635 | -0.113 |
TDOC Stock Price Chart Interactive Chart >
TDOC Price/Volume Stats
Current price | $28.48 | 52-week high | $80.83 |
Prev. close | $29.47 | 52-week low | $21.60 |
Day low | $28.36 | Volume | 2,114,570 |
Day high | $29.51 | Avg. volume | 4,337,420 |
50-day MA | $26.45 | Dividend yield | N/A |
200-day MA | $32.55 | Market Cap | 4.61B |
Teladoc Health Inc. (TDOC) Company Bio
Teladoc Health, Inc. is a multinational telemedicine and virtual healthcare company headquartered in the United States. Primary services include telehealth, medical opinions, AI and analytics, telehealth devices and licensable platform services. In particular, Teladoc Health uses telephone and videoconferencing software as well as mobile apps to provide on-demand remote medical care. Billed as the first and largest telemedicine company in the United States, Teladoc Health was launched in 2002 and has acquired companies such as BetterHelp in 2015, Best Doctors in 2017, and Advance Medical in 2018. It trades on the NYSE and in 2019 was active in 130 countries and served around 40 million members in 2021. (Source:Wikipedia)
Latest TDOC News From Around the Web
Below are the latest news stories about TELADOC HEALTH INC that investors may wish to consider to help them evaluate TDOC as an investment opportunity.
Cathie Wood Gets Back on Track; Here Are 2 Stocks She’s Snapping UpCathie Wood made her name by backing growth-oriented and cutting-edge stocks with her Ark Innovation ETF (ARKK) delivering huge returns for investors before and during the Covid-era. That all changed, however, as market sentiment shifted, and the past two years have seen the once-lauded investor’s reputation take a hit with the ARKK fund posting huge losses. But, so far, 2023 is turning out to be a turnaround story. ARKK is up nearly 20% since the turn of the year. Meanwhile, Wood has been loadi |
1 Excellent Growth Stock to Buy Near Its 52-Week LowTelehealth specialist Teladoc (NYSE: TDOC) is a corporation at the intersection of these two categories, so it isn't surprising that its shares were hammered in 2022. The company could eventually turn things around and possibly deliver market-beating returns. Teladoc experienced a hard year in 2022, partly due to massive net losses associated with impairment charges linked to the company's acquisition of Livongo Health back in 2020. |
Is Trending Stock Teladoc Health, Inc. (TDOC) a Buy Now?Teladoc (TDOC) has been one of the stocks most watched by Zacks.com users lately. So, it is worth exploring what lies ahead for the stock. |
Teladoc Stock: Buy, Sell, or Hold in 2023?This high-growth stock is making all the right moves. |
Did Teladoc Just Take a Big Step Towards Profitability?Teladoc is winning when it comes to revenue and membership growth -- but profit has been elusive. |
TDOC Price Returns
1-mo | 20.42% |
3-mo | -1.39% |
6-mo | -26.03% |
1-year | -59.55% |
3-year | -72.00% |
5-year | -23.85% |
YTD | 20.42% |
2022 | -74.24% |
2021 | -54.08% |
2020 | 138.84% |
2019 | 68.89% |
2018 | 42.24% |
Continue Researching TDOC
Here are a few links from around the web to help you further your research on Teladoc Health Inc's stock as an investment opportunity:Teladoc Health Inc (TDOC) Stock Price | Nasdaq
Teladoc Health Inc (TDOC) Stock Quote, History and News - Yahoo Finance
Teladoc Health Inc (TDOC) Stock Price and Basic Information | MarketWatch
Loading social stream, please wait...