
ThredUp Inc. (TDUP): Price and Financial Metrics
TDUP Price/Volume Stats
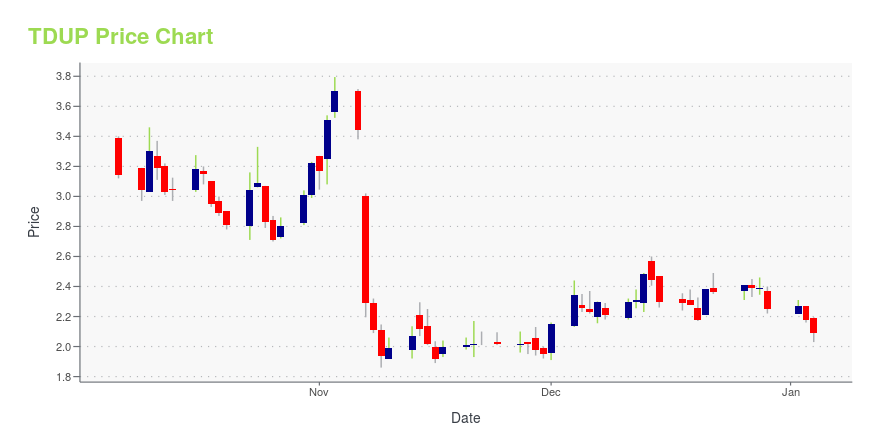
| Current price | $2.09 | 52-week high | $4.39 |
| Prev. close | $2.03 | 52-week low | $1.51 |
| Day low | $1.99 | Volume | 308,925 |
| Day high | $2.10 | Avg. volume | 513,115 |
| 50-day MA | $1.88 | Dividend yield | N/A |
| 200-day MA | $2.09 | Market Cap | 230.44M |
TDUP Stock Price Chart Interactive Chart >
ThredUp Inc. (TDUP) Company Bio
ThredUp Inc. operates online resale platforms that allows consumers to buy and sell secondhand women's and kids' apparel, shoes, and accessories. The company was founded in 2009 and is based in Oakland, California.
Latest TDUP News From Around the Web
Below are the latest news stories about THREDUP INC that investors may wish to consider to help them evaluate TDUP as an investment opportunity.
thredUP to Participate in Barclays ConferenceOAKLAND, Calif., Nov. 30, 2023 (GLOBE NEWSWIRE) -- ThredUp Inc. (NASDAQ: TDUP, LTSE: TDUP), one of the largest online resale platforms for apparel, shoes, and accessories, announced today that CEO and co-founder James Reinhart and CFO Sean Sobers will participate in the following investor conference: Barclays Global Technology ConferenceThursday, Dec 7, 202311:00 - 11:30 AM PT / 2:00 - 2:30 PM ET The event will be webcast live on thredUP’s investor website at https://ir.thredup.com/. A replay wi |
Insider Sell Alert: President Anthony Marino Sells 83,130 Shares of ThredUp Inc (TDUP)In a notable insider transaction, President Anthony Marino of ThredUp Inc (NASDAQ:TDUP) has sold a significant number of shares in the company. |
Rebag Announces Partnership With Online Resale Platform thredUPRebag, the authority in buying, consigning, trading, and selling luxury accessories including handbags, fine jewelry, watches, and more, today announced a multifaceted partnership with thredUP (NASDAQ: TDUP, LTSE: TDUP), one of the largest online resale platforms. Rebag customers can now resell gently-worn items on thredUP for Rebag shopping credit, and thredUP customers can shop select Rebag inventory directly on thredup.com. |
Favourable Signals For ThredUp: Numerous Insiders Acquired StockUsually, when one insider buys stock, it might not be a monumental event. But when multiple insiders are buying like... |
Why ThredUp Stock Plunged 36% TodayShares of online retailer ThredUp (NASDAQ: TDUP) were down as much as 36.3% in trading on Tuesday after the company reported third-quarter financial results. Revenue rose 21% versus a year ago to $82 million but reported a net loss of $18.1 million, only a slight improvement from a loss of $23.7 million a year ago. Management expects fourth-quarter revenue to fall to between $79 million and $81 million with an adjusted EBITDA loss margin of 2% to breakeven. |
TDUP Price Returns
| 1-mo | 26.67% |
| 3-mo | 29.81% |
| 6-mo | -7.93% |
| 1-year | -36.86% |
| 3-year | -91.92% |
| 5-year | N/A |
| YTD | -7.11% |
| 2023 | 71.76% |
| 2022 | -89.73% |
| 2021 | N/A |
| 2020 | N/A |
| 2019 | N/A |
Loading social stream, please wait...