Tidewater Inc. (TDW): Price and Financial Metrics
TDW Price/Volume Stats
Current price | $68.12 | 52-week high | $73.55 |
Prev. close | $67.43 | 52-week low | $22.62 |
Day low | $66.15 | Volume | 655,591 |
Day high | $68.30 | Avg. volume | 798,937 |
50-day MA | $64.83 | Dividend yield | N/A |
200-day MA | $49.94 | Market Cap | 3.59B |
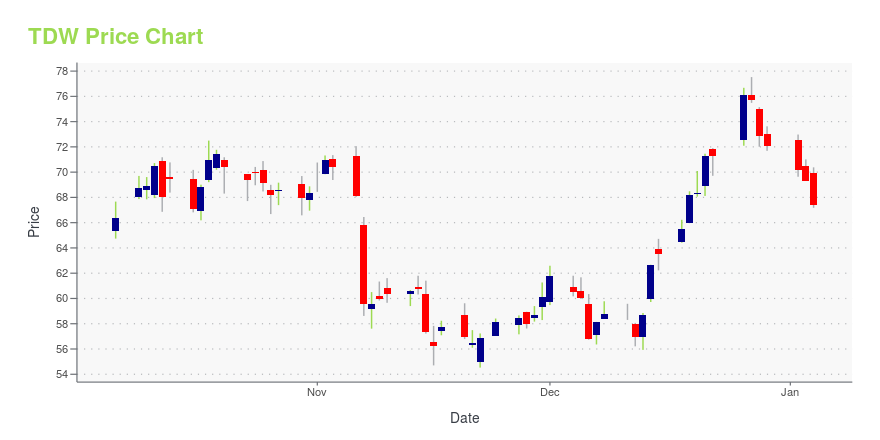
TDW Stock Price Chart Interactive Chart >
TDW POWR Grades
- TDW scores best on the Momentum dimension, with a Momentum rank ahead of 99.08% of US stocks.
- The strongest trend for TDW is in Growth, which has been heading up over the past 177 days.
- TDW ranks lowest in Value; there it ranks in the 1st percentile.
TDW Stock Summary
- With a price/earnings ratio of 70.38, TIDEWATER INC P/E ratio is greater than that of about 92.22% of stocks in our set with positive earnings.
- In terms of twelve month growth in earnings before interest and taxes, TIDEWATER INC is reporting a growth rate of -228.12%; that's higher than just 6.43% of US stocks.
- Revenue growth over the past 12 months for TIDEWATER INC comes in at 68.52%, a number that bests 92.18% of the US stocks we're tracking.
- Stocks that are quantitatively similar to TDW, based on their financial statements, market capitalization, and price volatility, are GFF, SPNT, BFI, AR, and OLB.
- TDW's SEC filings can be seen here. And to visit TIDEWATER INC's official web site, go to www.tdw.com.
TDW Valuation Summary
- In comparison to the median Energy stock, TDW's EV/EBIT ratio is 376.13% higher, now standing at 36.9.
- TDW's EV/EBIT ratio has moved up 21.7 over the prior 243 months.
Below are key valuation metrics over time for TDW.
Stock | Date | P/S | P/B | P/E | EV/EBIT |
---|---|---|---|---|---|
TDW | 2023-09-14 | 4.6 | 4.1 | 73.3 | 36.9 |
TDW | 2023-09-13 | 4.6 | 4.0 | 72.7 | 36.6 |
TDW | 2023-09-12 | 4.7 | 4.2 | 75.7 | 38.1 |
TDW | 2023-09-11 | 4.7 | 4.2 | 75.3 | 37.9 |
TDW | 2023-09-08 | 4.6 | 4.1 | 73.7 | 37.1 |
TDW | 2023-09-07 | 4.5 | 3.9 | 71.4 | 35.9 |
TDW Growth Metrics
- Its 4 year revenue growth rate is now at -20.09%.
- Its 5 year cash and equivalents growth rate is now at -71.65%.
- Its 3 year cash and equivalents growth rate is now at -64.53%.

The table below shows TDW's growth in key financial areas (numbers in millions of US dollars).
Date | Revenue | Operating Cash Flow | Net Income to Common Stock |
---|---|---|---|
2022-09-30 | 566.113 | 1.824 | -70.303 |
2022-06-30 | 466.752 | -28.788 | -101.941 |
2022-03-31 | 393.258 | -2.334 | -105.822 |
2021-12-31 | 371.033 | 15.006 | -128.969 |
2021-09-30 | 357.717 | 10.248 | -120.282 |
2021-06-30 | 351.783 | 27.376 | -131.951 |
TDW's Quality Factors
The “Quality” component of the POWR Ratings focuses on 31 different factors of a companies fundamentals and operational strength. Here are some key insights as we drill into the specifics of these quality attributes.- TDW has a Quality Grade of C, ranking ahead of 57.29% of graded US stocks.
- TDW's asset turnover comes in at 0.285 -- ranking 70th of 137 Transportation stocks.
- SHLX, KNOP, and HUBG are the stocks whose asset turnover ratios are most correlated with TDW.
The table below shows TDW's key quality metrics over time.
Period | Asset Turnover | Gross Margin | ROIC |
---|---|---|---|
2021-06-30 | 0.285 | 0.282 | -0.093 |
2021-03-31 | 0.280 | 0.306 | -0.157 |
2020-12-31 | 0.285 | 0.314 | -0.136 |
2020-09-30 | 0.287 | 0.303 | -0.145 |
2020-06-30 | 0.290 | 0.312 | -0.132 |
2020-03-31 | 0.288 | 0.313 | -0.060 |
TDW Price Target
For more insight on analysts targets of TDW, see our TDW price target page. And for a list of of all stocks sorted by upside potential based on analyst target price, see our Top Price Target page.
Average Price Target | $15.33 | Average Broker Recommendation | 1.67 (Moderate Buy) |
Tidewater Inc. (TDW) Company Bio
Tidewater Inc. provides offshore service vessels and marine support services through the operation of a fleet of marine service vessels to the offshore energy industry worldwide. The company was founded in 1956 and is based in New Orleans, Louisiana.
Latest TDW News From Around the Web
Below are the latest news stories about TIDEWATER INC that investors may wish to consider to help them evaluate TDW as an investment opportunity.
Tidewater's (TDW) GVA Deal With Caterpillar to Boost UptimeThrough this agreement, Tidewater (TDW) aims to enhance efficiency, reduce costs, and ensure maximum uptime for its fleet of vessels. |
3 Offshore Oil Stocks Riding the Waves of MomentumBut these companies are working under the radar, generating energy and whopping gains for investors able to recognize their potential. |
Unveiling Tidewater (TDW)'s Value: Is It Really Priced Right? A Comprehensive GuideUnderstanding the intrinsic value of Tidewater and its potential for future growth |
Betting Big: 3 Growth Stocks Primed for a BreakoutThese three growth stocks to buy now have explosive potential and great fundamentals behind them to take them to new heights. |
EVP, COO David Darling Sells 19,500 Shares of Tidewater Inc (TDW)On September 6, 2023, David Darling, the Executive Vice President and Chief Operating Officer of Tidewater Inc, sold 19,500 shares of the company. |
TDW Price Returns
1-mo | 0.65% |
3-mo | 25.41% |
6-mo | 57.25% |
1-year | 197.73% |
3-year | 962.71% |
5-year | 113.07% |
YTD | 84.86% |
2022 | 244.07% |
2021 | 23.96% |
2020 | -55.19% |
2019 | 0.78% |
2018 | -21.60% |
Continue Researching TDW
Want to do more research on Tidewater Inc's stock and its price? Try the links below:Tidewater Inc (TDW) Stock Price | Nasdaq
Tidewater Inc (TDW) Stock Quote, History and News - Yahoo Finance
Tidewater Inc (TDW) Stock Price and Basic Information | MarketWatch
Loading social stream, please wait...