Atlassian Corp. Cl A (TEAM): Price and Financial Metrics
GET POWR RATINGS... FREE!
TEAM POWR Grades
- TEAM scores best on the Quality dimension, with a Quality rank ahead of 83.81% of US stocks.
- TEAM's strongest trending metric is Growth; it's been moving down over the last 177 days.
- TEAM ranks lowest in Stability; there it ranks in the 16th percentile.
TEAM Stock Summary
- With a market capitalization of $40,469,255,699, ATLASSIAN CORP has a greater market value than 93.97% of US stocks.
- ATLASSIAN CORP's capital turnover -- a measure of revenue relative to shareholder's equity -- is better than 93.51% of US listed stocks.
- With a price/sales ratio of 13.51, ATLASSIAN CORP has a higher such ratio than 91.49% of stocks in our set.
- If you're looking for stocks that are quantitatively similar to ATLASSIAN CORP, a group of peers worth examining would be WDAY, MRVL, U, SNAP, and LASR.
- TEAM's SEC filings can be seen here. And to visit ATLASSIAN CORP's official web site, go to www.atlassian.com.
TEAM Valuation Summary
- In comparison to the median Technology stock, TEAM's price/earnings ratio is 788.72% lower, now standing at -177.
- TEAM's price/sales ratio has moved up 1.1 over the prior 87 months.
Below are key valuation metrics over time for TEAM.
Stock | Date | P/S | P/B | P/E | EV/EBIT |
---|---|---|---|---|---|
TEAM | 2023-01-20 | 13.5 | 83.9 | -177.0 | -261.9 |
TEAM | 2023-01-19 | 12.7 | 79.2 | -167.0 | -247.1 |
TEAM | 2023-01-18 | 12.7 | 79.1 | -166.9 | -246.8 |
TEAM | 2023-01-17 | 13.0 | 81.3 | -171.5 | -253.8 |
TEAM | 2023-01-13 | 12.6 | 78.7 | -166.0 | -245.6 |
TEAM | 2023-01-12 | 12.5 | 77.9 | -164.3 | -243.1 |
TEAM Growth Metrics
- Its 5 year revenue growth rate is now at 164.88%.
- Its 4 year cash and equivalents growth rate is now at 579.69%.
- Its year over year cash and equivalents growth rate is now at 3.77%.

The table below shows TEAM's growth in key financial areas (numbers in millions of US dollars).
Date | Revenue | Operating Cash Flow | Net Income to Common Stock |
---|---|---|---|
2022-09-30 | 2,996.25 | 897.552 | -227.763 |
2022-06-30 | 2,802.882 | 883.496 | -614.124 |
2022-06-30 | 2,802.882 | 883.496 | -614.124 |
2022-03-31 | 2,602.58 | 837.466 | -721.734 |
2022-03-31 | 2,602.58 | 837.466 | -721.734 |
2021-12-31 | 2,430.817 | 861.473 | -530.807 |
TEAM's Quality Factors
The “Quality” component of the POWR Ratings focuses on 31 different factors of a companies fundamentals and operational strength. Here are some key insights as we drill into the specifics of these quality attributes.- TEAM has a Quality Grade of B, ranking ahead of 81.21% of graded US stocks.
- TEAM's asset turnover comes in at 0.677 -- ranking 235th of 561 Business Services stocks.
- VVI, HPTO, and CARS are the stocks whose asset turnover ratios are most correlated with TEAM.
The table below shows TEAM's key quality metrics over time.
Period | Asset Turnover | Gross Margin | ROIC |
---|---|---|---|
2021-09-30 | 0.677 | 0.839 | 2.149 |
2021-09-30 | 0.677 | 0.839 | 2.149 |
2021-06-30 | 0.603 | 0.839 | 1.148 |
2021-06-30 | 0.603 | 0.839 | 1.148 |
2021-03-31 | 0.529 | 0.843 | 1.862 |
2021-03-31 | 0.529 | 0.843 | 1.862 |
TEAM Price Target
For more insight on analysts targets of TEAM, see our TEAM price target page. And for a list of of all stocks sorted by upside potential based on analyst target price, see our Top Price Target page.
Average Price Target | $271.71 | Average Broker Recommendation | 1.52 (Moderate Buy) |
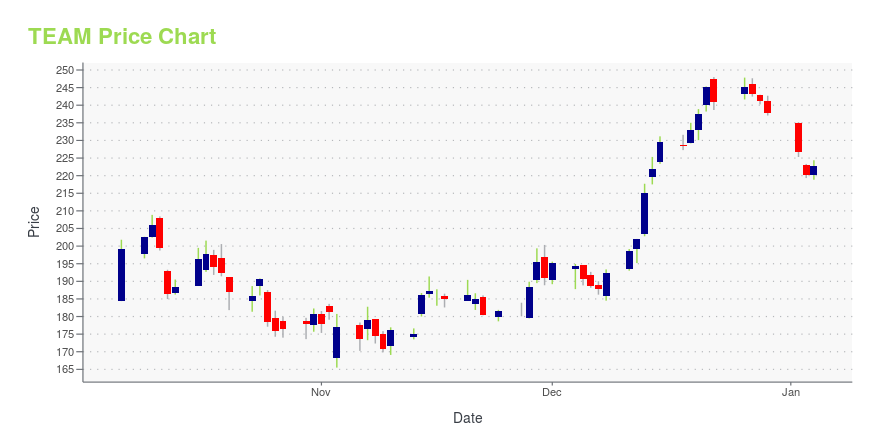
TEAM Stock Price Chart Interactive Chart >
TEAM Price/Volume Stats
Current price | $164.25 | 52-week high | $352.92 |
Prev. close | $158.38 | 52-week low | $113.86 |
Day low | $155.50 | Volume | 2,758,100 |
Day high | $165.06 | Avg. volume | 2,657,156 |
50-day MA | $135.99 | Dividend yield | N/A |
200-day MA | $193.73 | Market Cap | 41.97B |
Atlassian Corp. Cl A (TEAM) Company Bio
Atlassian Corporation (/ətˈlæsiən/) is an Australian software company that develops products for software developers, project managers and other software development teams. The company is domiciled in Delaware, with global headquarters in Sydney, Australia, and US headquarters in San Francisco. (Source:Wikipedia)
Latest TEAM News From Around the Web
Below are the latest news stories about ATLASSIAN CORP that investors may wish to consider to help them evaluate TEAM as an investment opportunity.
Atlassian, DocuSign stocks down on Microsoft guidanceYahoo Finance's Brad Smith breaks down how markets are trading, plus how Microsoft earnings are weighing on software stocks. |
Where Will Atlassian Be in 1 Year?Investors will have to decide whether the reason for the stock surge is a bear market rally or the beginnings of a recovery. |
This 90-minute exercise can help you ditch unnecessary meetingsAs a new year begins, it’s a great time to renew your team’s working methods. And one resolution at the top of most teams’ lists is to cut meetings to make more time for deep work. |
1 Magnificent Growth Stock Down 68% to Buy Now Before It ReboundsThis software company has a strong competitive position and differentiated portfolio, and those qualities should translate into market-beating returns for patient shareholders. |
Atlassian: Profitability Issues, Project Management Software Overload (NASDAQ:TEAM)Atlassian has struggled to maintain high profit margins and is experiencing slowing growth. See why we do not view risk/reward in TEAM attractive at this time. |
TEAM Price Returns
1-mo | 27.64% |
3-mo | -18.98% |
6-mo | -23.32% |
1-year | -48.54% |
3-year | 9.81% |
5-year | 207.64% |
YTD | 27.64% |
2022 | -66.25% |
2021 | 63.04% |
2020 | 94.34% |
2019 | 35.24% |
2018 | 95.47% |
Continue Researching TEAM
Want to do more research on Atlassian Corp Plc's stock and its price? Try the links below:Atlassian Corp Plc (TEAM) Stock Price | Nasdaq
Atlassian Corp Plc (TEAM) Stock Quote, History and News - Yahoo Finance
Atlassian Corp Plc (TEAM) Stock Price and Basic Information | MarketWatch
Loading social stream, please wait...