
Bio-Techne Corp (TECH): Price and Financial Metrics
TECH Price/Volume Stats
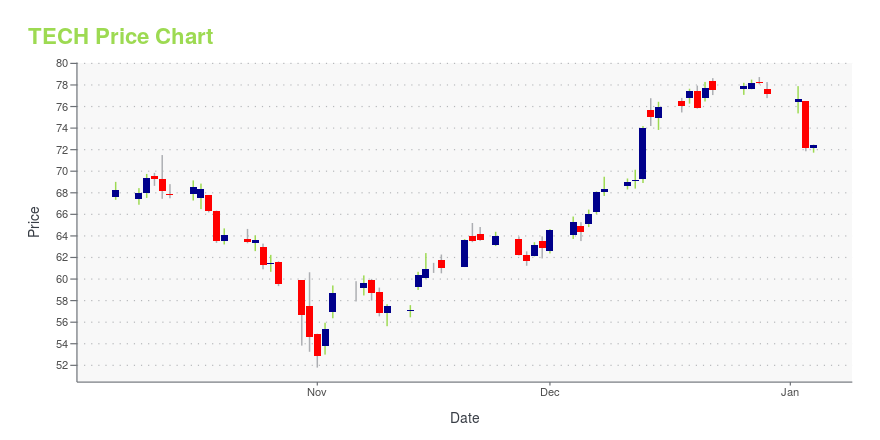
| Current price | $80.60 | 52-week high | $85.95 |
| Prev. close | $78.67 | 52-week low | $51.79 |
| Day low | $78.77 | Volume | 969,063 |
| Day high | $81.32 | Avg. volume | 1,068,673 |
| 50-day MA | $76.79 | Dividend yield | 0.42% |
| 200-day MA | $70.89 | Market Cap | 12.70B |
TECH Stock Price Chart Interactive Chart >
Bio-Techne Corp (TECH) Company Bio
Bio-Techne Corporation is a global life sciences company providing innovative tools and bioactive reagents for the research and clinical diagnostic communities. The company was founded in 1976 and is based in Minneapolis, Minnesota.
Latest TECH News From Around the Web
Below are the latest news stories about BIO-TECHNE CORP that investors may wish to consider to help them evaluate TECH as an investment opportunity.
BIO-TECHNE TO PRESENT AT THE 42nd ANNUAL J.P. MORGAN HEALTHCARE CONFERENCEBio-Techne Corporation (NASDAQ: TECH) today announced that Kim Kelderman, current Chief Operating Officer, and Chief Executive Officer effective February 1, 2024, will present at the 42nd Annual J.P. Morgan Healthcare Conference on Wednesday, January 10, 2024, at 9:00 a.m. PST. A live webcast of the presentation can be accessed via the IR Calendar page of Bio-Techne's Investor Relations website at https://investors.bio-techne.com/ir-calendar. |
BIO-TECHNE ANNOUNCES SUBMISSION OF FDA DRUG MASTER FILE FOR EXCELLERATE GMP IPSC EXPANSION MEDIUM SUPPORTING STEM CELL THERAPYBio-Techne Corporation (NASDAQ: TECH) today announced that it has filed a Drug Master File (DMF) with the U.S. Food and Drug Administration (FDA) for its ExCellerate™ GMP iPSC Expansion Medium, Animal Free (CCM0036-GMP), supporting the development and manufacture of regenerative medicine and stem cell therapies. |
LUNAPHORE AND SIB AWARDED INNOSUISSE FUNDING TO DEVELOP INNOVATIVE AI-BASED ASSAY DEVELOPMENT TOOLSBio-Techne Corporation (NASDAQ: TECH) today announced that Lunaphore, a Bio-Techne brand, and SIB Swiss Institute of Bioinformatics, have been awarded Innosuisse funding for an innovation project. The collaboration aims to develop novel AI-based assay development tools for spatial biology on Lunaphore's COMET™ to further accelerate the adoption of multiplex sequential immunofluorescence (seqIF™) technology in research. |
Should You Hold Bio-Techne Corporation (TECH) For the Long Term?Fred Alger Management, an investment management company, released its “Alger Small Cap Growth Fund” third quarter 2023 investor letter. A copy of the same can be downloaded here. In the third quarter, the fund outperformed the Russell 2000 Growth Index. The Information Technology and Healthcare sectors contributed to the fund’s relative performance in the quarter, […] |
BIO-TECHNE TO PRESENT AT THE 6TH ANNUAL EVERCORE ISI HEALTHCONx CONFERENCEBio-Techne Corporation (NASDAQ: TECH) today announced that Chuck Kummeth, President and Chief Executive Officer, and Kim Kelderman, Chief Operating Officer will present at the 6th Annual Evercore ISI HealthCONx Conference on Wednesday, November 29, 2023, at 2:10 p.m. EST. A live webcast of the presentation can be accessed via the IR Calendar page of Bio-Techne's Investor Relations website at https://investors.bio-techne.com/ir-calendar. |
TECH Price Returns
| 1-mo | 11.79% |
| 3-mo | 25.95% |
| 6-mo | 11.22% |
| 1-year | -3.24% |
| 3-year | -31.13% |
| 5-year | 53.50% |
| YTD | 4.69% |
| 2023 | -6.49% |
| 2022 | -35.68% |
| 2021 | 63.40% |
| 2020 | 45.40% |
| 2019 | 52.67% |
TECH Dividends
| Ex-Dividend Date | Type | Payout Amount | Change | ||||||
|---|---|---|---|---|---|---|---|---|---|
| Loading, please wait... | |||||||||
Continue Researching TECH
Want to see what other sources are saying about BIO-TECHNE Corp's financials and stock price? Try the links below:BIO-TECHNE Corp (TECH) Stock Price | Nasdaq
BIO-TECHNE Corp (TECH) Stock Quote, History and News - Yahoo Finance
BIO-TECHNE Corp (TECH) Stock Price and Basic Information | MarketWatch
Loading social stream, please wait...