
Telefonica S.A. ADR (TEF): Price and Financial Metrics
TEF Price/Volume Stats
| Current price | $5.18 | 52-week high | $5.48 |
| Prev. close | $5.21 | 52-week low | $3.89 |
| Day low | $5.14 | Volume | 252,257 |
| Day high | $5.20 | Avg. volume | 697,875 |
| 50-day MA | $5.17 | Dividend yield | 4.8% |
| 200-day MA | $4.65 | Market Cap | 29.37B |
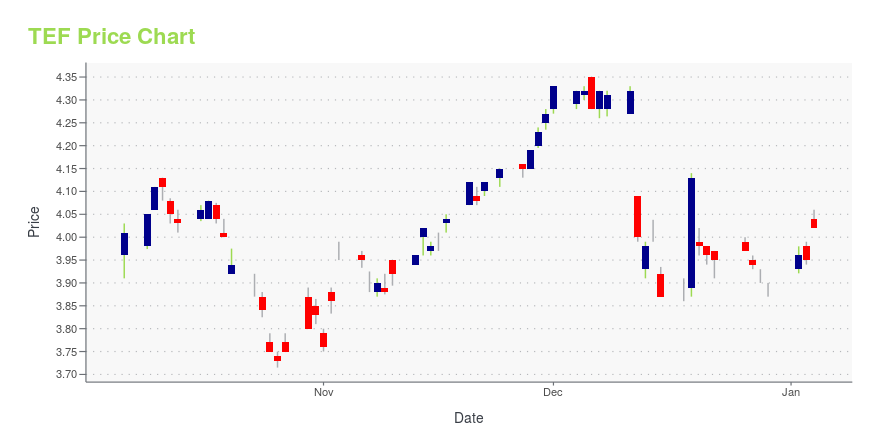
TEF Stock Price Chart Interactive Chart >
Telefonica S.A. ADR (TEF) Company Bio
Telefónica, S.A. (Spanish pronunciation: [teleˈfonika]) is a Spanish multinational telecommunications company headquartered in Madrid, Spain. It is one of the largest telephone operators and mobile network providers in the world. It provides fixed and mobile telephony, broadband, and subscription television, operating in Europe and the Americas. (Source:Wikipedia)
TEF Price Returns
| 1-mo | 1.23% |
| 3-mo | 10.50% |
| 6-mo | 32.27% |
| 1-year | 25.17% |
| 3-year | 28.71% |
| 5-year | 43.59% |
| YTD | 31.94% |
| 2024 | 8.68% |
| 2023 | 15.58% |
| 2022 | -11.32% |
| 2021 | 11.27% |
| 2020 | -38.17% |
TEF Dividends
| Ex-Dividend Date | Type | Payout Amount | Change | ||||||
|---|---|---|---|---|---|---|---|---|---|
| Loading, please wait... | |||||||||
Continue Researching TEF
Want to do more research on Telefonica S A's stock and its price? Try the links below:Telefonica S A (TEF) Stock Price | Nasdaq
Telefonica S A (TEF) Stock Quote, History and News - Yahoo Finance
Telefonica S A (TEF) Stock Price and Basic Information | MarketWatch
Loading social stream, please wait...