
Tellurian Inc. (TELL): Price and Financial Metrics
TELL Price/Volume Stats
| Current price | $0.92 | 52-week high | $1.72 |
| Prev. close | $0.94 | 52-week low | $0.36 |
| Day low | $0.82 | Volume | 102,288,776 |
| Day high | $0.94 | Avg. volume | 41,127,387 |
| 50-day MA | $0.67 | Dividend yield | N/A |
| 200-day MA | $0.64 | Market Cap | 769.50M |
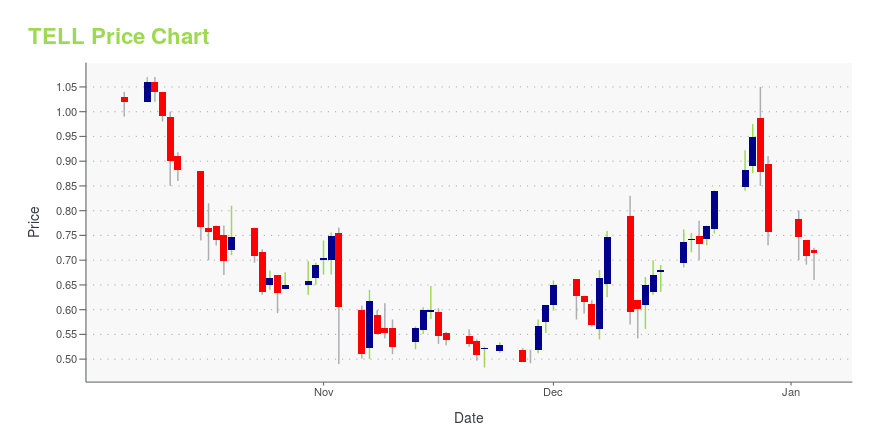
TELL Stock Price Chart Interactive Chart >
Tellurian Inc. (TELL) Company Bio
Tellurian Inc., formerly known as Magellan Petroleum Corporation, plans to build a natural gas business that includes 26 mtpa production from Driftwood LNG, trading of LNG cargoes, and development of new markets globally.
Latest TELL News From Around the Web
Below are the latest news stories about TELLURIAN INC that investors may wish to consider to help them evaluate TELL as an investment opportunity.
Charif Souki, Godfather of American LNG Industry, Is Ousted from TellurianEnergy trailblazer Charif Souki has left Tellurian the flailing gas-export company he co-founded. The company in a regulatory filing released Wednesday said Tellurian had executed a separation and release agreement with Souki. As part of the agreement, Souki resigned from his board seat. |
Tellurian Board of Directors names Daniel Belhumeur as President, Meredith Mouer as General Counsel and Chief Compliance OfficerHOUSTON, December 11, 2023--Tellurian Inc. (Tellurian or the Company) (NYSE American: TELL) announced today that following the appointment of Martin J. Houston as Chairman of the Board, the Board of Directors has named former General Counsel Daniel Belhumeur as President of Tellurian, and former Deputy General Counsel Meredith Mouer as General Counsel and Chief Compliance Officer of Tellurian. |
Charif Souki, Who Transformed U.S. Energy, Removed as Tellurian’s ChairmanNatural gas pioneer Charif Souki on Friday was removed as executive chairman of Tellurian the struggling export company he co-founded. Tellurian said in a press release late Friday that its board of directors had named vice chairman and co-founder Martin Houston as chairman. It said that Souki would no longer serve as an executive or officer of the company or hold any managerial responsibilities. |
Tellurian names Martin Houston as chairMore on Tellurian... |
Martin Houston Becomes Chairman of Tellurian Inc.HOUSTON, December 08, 2023--Tellurian Inc. (Tellurian or the Company) (NYSE American: TELL) announced today that its Board of Directors has named Martin Houston, Co-Founder and Vice Chairman, to be Chairman of the Board of Directors. Co-Founder Charif Souki will no longer serve as an executive or officer of the Company or hold any managerial responsibilities. Mr. Souki remains a member of the Board of Directors. |
TELL Price Returns
| 1-mo | 27.81% |
| 3-mo | 97.09% |
| 6-mo | 67.27% |
| 1-year | -39.47% |
| 3-year | -73.10% |
| 5-year | -86.86% |
| YTD | 21.76% |
| 2023 | -55.02% |
| 2022 | -45.45% |
| 2021 | 140.63% |
| 2020 | -82.42% |
| 2019 | 4.75% |
Continue Researching TELL
Want to do more research on Tellurian Inc's stock and its price? Try the links below:Tellurian Inc (TELL) Stock Price | Nasdaq
Tellurian Inc (TELL) Stock Quote, History and News - Yahoo Finance
Tellurian Inc (TELL) Stock Price and Basic Information | MarketWatch
Loading social stream, please wait...