Teradyne Inc. (TER): Price and Financial Metrics
GET POWR RATINGS... FREE!
TER POWR Grades
- TER scores best on the Quality dimension, with a Quality rank ahead of 96.65% of US stocks.
- The strongest trend for TER is in Stability, which has been heading down over the past 178 days.
- TER's current lowest rank is in the Growth metric (where it is better than 6.51% of US stocks).
TER Stock Summary
- TER has a market capitalization of $16,400,630,927 -- more than approximately 88.63% of US stocks.
- TER's went public 36.05 years ago, making it older than 92.63% of listed US stocks we're tracking.
- With a year-over-year growth in debt of -28.01%, TERADYNE INC's debt growth rate surpasses just 10.6% of about US stocks.
- Stocks with similar financial metrics, market capitalization, and price volatility to TERADYNE INC are HLIT, JNPR, CMBM, ACLS, and VICR.
- TER's SEC filings can be seen here. And to visit TERADYNE INC's official web site, go to www.teradyne.com.
TER Valuation Summary
- TER's EV/EBIT ratio is 18.6; this is 1.59% lower than that of the median Technology stock.
- Over the past 243 months, TER's EV/EBIT ratio has gone up 23.
Below are key valuation metrics over time for TER.
Stock | Date | P/S | P/B | P/E | EV/EBIT |
---|---|---|---|---|---|
TER | 2023-03-14 | 5.2 | 6.7 | 22.9 | 18.6 |
TER | 2023-03-13 | 5.1 | 6.5 | 22.4 | 18.1 |
TER | 2023-03-10 | 5.0 | 6.4 | 22.1 | 17.9 |
TER | 2023-03-09 | 5.1 | 6.5 | 22.3 | 18.0 |
TER | 2023-03-08 | 5.1 | 6.6 | 22.5 | 18.2 |
TER | 2023-03-07 | 5.0 | 6.4 | 21.9 | 17.7 |
TER Growth Metrics
- Its 2 year price growth rate is now at 80.81%.
- Its 2 year cash and equivalents growth rate is now at 33.89%.
- Its 4 year net cashflow from operations growth rate is now at 68.7%.

The table below shows TER's growth in key financial areas (numbers in millions of US dollars).
Date | Revenue | Operating Cash Flow | Net Income to Common Stock |
---|---|---|---|
2022-12-31 | 3,155.045 | 577.923 | 715.501 |
2022-09-30 | 3,308.255 | 725.804 | 767.24 |
2022-06-30 | 3,431.683 | 976.86 | 840.473 |
2022-03-31 | 3,676.645 | 1,067.689 | 971.005 |
2021-12-31 | 3,702.881 | 1,098.366 | 1,014.589 |
2021-09-30 | 3,576.804 | 1,027.507 | 986.881 |
TER's Quality Factors
The “Quality” component of the POWR Ratings focuses on 31 different factors of a companies fundamentals and operational strength. Here are some key insights as we drill into the specifics of these quality attributes.- TER has a Quality Grade of A, ranking ahead of 96.37% of graded US stocks.
- TER's asset turnover comes in at 0.931 -- ranking 14th of 75 Measuring and Control Equipment stocks.
- TRNS, PBIO, and SMIT are the stocks whose asset turnover ratios are most correlated with TER.
The table below shows TER's key quality metrics over time.
Period | Asset Turnover | Gross Margin | ROIC |
---|---|---|---|
2021-07-04 | 0.931 | 0.585 | 0.577 |
2021-04-04 | 0.910 | 0.576 | 0.506 |
2020-12-31 | 0.949 | 0.572 | 0.522 |
2020-09-27 | 0.982 | 0.570 | 0.522 |
2020-06-28 | 0.962 | 0.578 | 0.463 |
2020-03-29 | 0.913 | 0.582 | 0.413 |
TER Price Target
For more insight on analysts targets of TER, see our TER price target page. And for a list of of all stocks sorted by upside potential based on analyst target price, see our Top Price Target page.
Average Price Target | $148.32 | Average Broker Recommendation | 1.57 (Moderate Buy) |
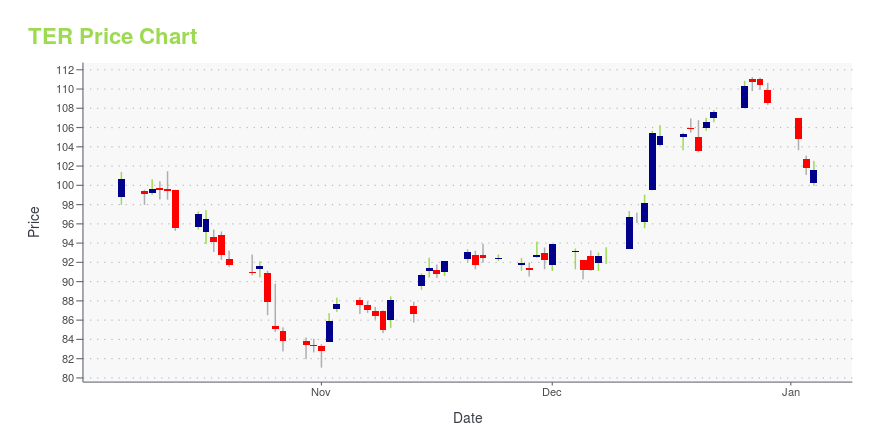
TER Stock Price Chart Interactive Chart >
TER Price/Volume Stats
Current price | $106.36 | 52-week high | $127.29 |
Prev. close | $106.50 | 52-week low | $67.81 |
Day low | $105.04 | Volume | 1,340,655 |
Day high | $108.28 | Avg. volume | 1,657,523 |
50-day MA | $102.77 | Dividend yield | 0.42% |
200-day MA | $92.73 | Market Cap | 16.60B |
Teradyne Inc. (TER) Company Bio
Teradyne, Inc. is an American automatic test equipment (ATE) designer and manufacturer based in North Reading, Massachusetts. Teradyne's high-profile customers include Samsung, Qualcomm, Intel, Analog Devices, Texas Instruments and IBM. (Source:Wikipedia)
Latest TER News From Around the Web
Below are the latest news stories about TERADYNE INC that investors may wish to consider to help them evaluate TER as an investment opportunity.
Warren Buffett Stocks: GOOGL Among 41 Names On This ScreenSee who joins GOOGL on this screen of Warren Buffett stocks based on the investing strategy of Berkshire Hathaway's CEO. |
Teradyne Stock Shows Rising Price Performance With Jump To 82 RS RatingTeradyne shows rising price performance, earning an upgrade to its IBD Relative Strength Rating from 79 to 82. |
What Does Teradyne, Inc.'s (NASDAQ:TER) Share Price Indicate?Let's talk about the popular Teradyne, Inc. ( NASDAQ:TER ). The company's shares led the NASDAQGS gainers with a... |
Why Is Teradyne (TER) Down 0.7% Since Last Earnings Report?Teradyne (TER) reported earnings 30 days ago. What's next for the stock? We take a look at earnings estimates for some clues. |
25 Biggest Massachusetts Companies and StocksIn this article, we will be taking a look at the 25 biggest Massachusetts companies and stocks. To skip our detailed analysis, you can go directly to see the 5 biggest Massachusetts companies and stocks. If all U.S. states were countries, Massachusetts would be 32nd largest economy in the world based on a 2021 GDP […] |
TER Price Returns
1-mo | 1.05% |
3-mo | 18.63% |
6-mo | 33.59% |
1-year | -11.66% |
3-year | 143.07% |
5-year | 129.22% |
YTD | 21.89% |
2022 | -46.35% |
2021 | 36.81% |
2020 | 76.73% |
2019 | 118.93% |
2018 | -24.37% |
TER Dividends
Ex-Dividend Date | Type | Payout Amount | Change | ||||||
---|---|---|---|---|---|---|---|---|---|
Loading, please wait... |
Continue Researching TER
Here are a few links from around the web to help you further your research on Teradyne Inc's stock as an investment opportunity:Teradyne Inc (TER) Stock Price | Nasdaq
Teradyne Inc (TER) Stock Quote, History and News - Yahoo Finance
Teradyne Inc (TER) Stock Price and Basic Information | MarketWatch
Loading social stream, please wait...