
TFI International Inc. (TFII): Price and Financial Metrics
TFII Price/Volume Stats
| Current price | $153.78 | 52-week high | $162.13 |
| Prev. close | $156.00 | 52-week low | $104.91 |
| Day low | $150.84 | Volume | 632,266 |
| Day high | $158.84 | Avg. volume | 273,057 |
| 50-day MA | $142.25 | Dividend yield | 1.04% |
| 200-day MA | $136.04 | Market Cap | 13.01B |
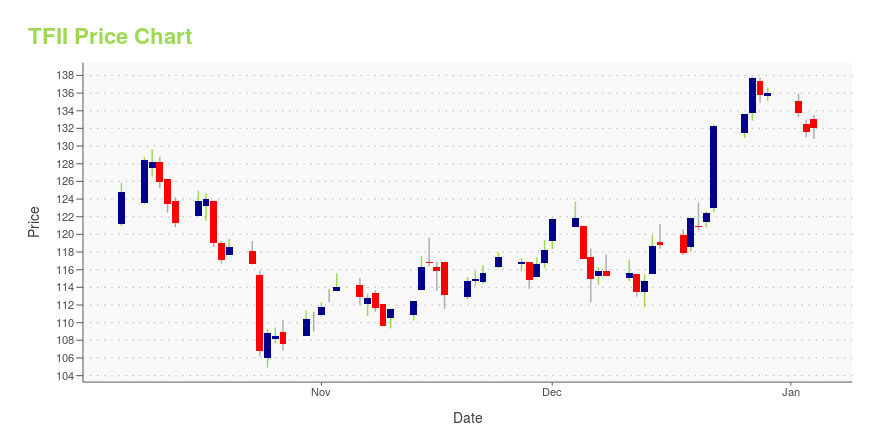
TFII Stock Price Chart Interactive Chart >
TFI International Inc. (TFII) Company Bio
TFI International Inc. is in the transportation and logistics industry. The Company identifies strategic acquisitions and manages a network of subsidiaries. TFI International operates across the United States, Canada, and Mexico.
Latest TFII News From Around the Web
Below are the latest news stories about TFI INTERNATIONAL INC that investors may wish to consider to help them evaluate TFII as an investment opportunity.
TFI International Inc. (TFII) Surges 8.1%: Is This an Indication of Further Gains?TFI International Inc. (TFII) was a big mover last session on higher-than-average trading volume. The latest trend in earnings estimate revisions might not help the stock continue moving higher in the near term. |
Are Investors Undervaluing TFI International Inc. (TSE:TFII) By 36%?Key Insights Using the 2 Stage Free Cash Flow to Equity, TFI International fair value estimate is CA$276 Current share... |
CANADA STOCKS-TSX climbs to 18-month high ahead of Christmas breakCanada's main stock index rose to an 18-month high on Friday, with the index posting broad-based gains ahead of the Christmas holiday weekend as cooling U.S. inflation bolstered investor hopes of a soft landing for the economy. The Toronto Stock Exchange's S&P/TSX composite index ended up 115.46 points, or 0.6%, at 20,881.19, its highest closing level since June 2022. It is set to be closed on Monday and Tuesday for Christmas Day and Boxing Day, respectively. |
Trucker TFI Is Buying Flatbed Heavyweight Daseke for About $386 MillionTFI International is buying trucking company Daseke in an all-cash deal for about $386 million that will make the company the largest operator by revenue of flatbed rigs targeting the construction industry. Montreal-based TFI will pay $8.30 a share for Daseke, a 69% premium to the closing stock price on Thursday, and will assume debt that will bring the total value of the deal to $1.1 billion. Based on an outstanding share count of about 46.5 million, the agreement values Addison, Texas-based Daseke at about $386 million. |
TFI buying Daseke for $1.1B, contemplating spinoff of truckload unitTFI International entered an agreement to acquire flatbed carrier Daseke and said it’s exploring a spinoff of its truckload business. The post TFI buying Daseke for $1.1B, contemplating spinoff of truckload unit appeared first on FreightWaves. |
TFII Price Returns
| 1-mo | 10.60% |
| 3-mo | 12.20% |
| 6-mo | 15.83% |
| 1-year | 24.95% |
| 3-year | 43.37% |
| 5-year | 438.43% |
| YTD | 14.31% |
| 2023 | 37.64% |
| 2022 | -9.48% |
| 2021 | 119.48% |
| 2020 | N/A |
| 2019 | 0.00% |
TFII Dividends
| Ex-Dividend Date | Type | Payout Amount | Change | ||||||
|---|---|---|---|---|---|---|---|---|---|
| Loading, please wait... | |||||||||
Loading social stream, please wait...