
Teleflex Inc. (TFX): Price and Financial Metrics
TFX Price/Volume Stats
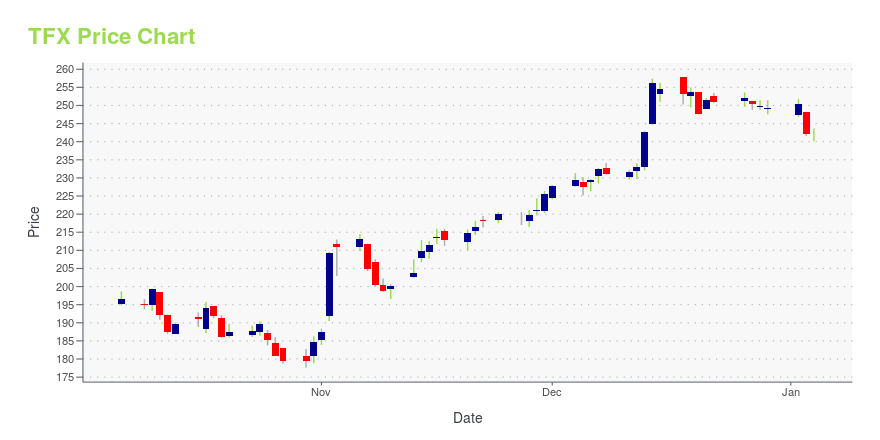
| Current price | $220.30 | 52-week high | $258.89 |
| Prev. close | $222.49 | 52-week low | $177.63 |
| Day low | $217.30 | Volume | 500,500 |
| Day high | $223.31 | Avg. volume | 366,738 |
| 50-day MA | $213.15 | Dividend yield | 0.61% |
| 200-day MA | $220.81 | Market Cap | 10.38B |
TFX Stock Price Chart Interactive Chart >
Teleflex Inc. (TFX) Company Bio
Teleflex Incorporated, headquartered in Wayne, Pennsylvania, is an American provider of specialty medical devices for a range of procedures in critical care and surgery. Teleflex has annual revenues of $2.4 billion, operations in 40 countries, and more than 12,000 employees. By 2011, the company had substantially realigned to focus on its current business as a medical-device manufacturer, having undergone several years of active acquisitions and divestitures. Teleflex has been associated with Irish corporate tax avoidance tools. Teleflex's current chief executive officer (CEO) is Liam J. Kelly, who took over from Benson F. Smith at the start of 2018; Kelly is also the company's president and former chief operating officer. (Source:Wikipedia)
Latest TFX News From Around the Web
Below are the latest news stories about TELEFLEX INC that investors may wish to consider to help them evaluate TFX as an investment opportunity.
Has Teleflex Incorporated's (NYSE:TFX) Impressive Stock Performance Got Anything to Do With Its Fundamentals?Most readers would already be aware that Teleflex's (NYSE:TFX) stock increased significantly by 28% over the past three... |
Teleflex to Present at the 42nd Annual J.P. Morgan Healthcare ConferenceWAYNE, Pa., Dec. 26, 2023 (GLOBE NEWSWIRE) -- Liam Kelly, Chairman, President and CEO, Teleflex Incorporated (NYSE: TFX), is scheduled to speak at the 42nd Annual J.P. Morgan Healthcare Conference at The Westin St. Francis in San Francisco, California, on Tuesday, January 9, 2024, at 3:00 p.m. (PT). A live audio webcast of the conference presentation, along with the accompanying slide presentation, will be available on the investor section of the Teleflex website at teleflex.com. About Teleflex |
These 2 MedTech Stocks Look Too Cheap to Ignore, Says Morgan StanleySince early this century, the high-tech sector has picked up headlines and accolades – and rightly so. Our world is evolving into a technology-driven landscape, with tech making significant contributions to diverse fields such as finance, communications, and aerospace. Yet, it’s worth noting that the medical field has also been influenced by tech, even though its impact often receives less recognition in the headlines. But less publicity hasn’t meant fewer investment opportunities, and investmen |
Why Is Waters (WAT) Up 13.2% Since Last Earnings Report?Waters (WAT) reported earnings 30 days ago. What's next for the stock? We take a look at earnings estimates for some clues. |
Teleflex (TFX) Signs Peripheral Access Purchasing Deal With PINCTeleflex (TFX) secures the Peripheral Access purchasing agreement with Premier, Inc. |
TFX Price Returns
| 1-mo | 10.13% |
| 3-mo | 6.75% |
| 6-mo | -9.59% |
| 1-year | -11.34% |
| 3-year | -44.34% |
| 5-year | -35.01% |
| YTD | -11.37% |
| 2023 | 0.49% |
| 2022 | -23.61% |
| 2021 | -19.89% |
| 2020 | 9.75% |
| 2019 | 46.26% |
TFX Dividends
| Ex-Dividend Date | Type | Payout Amount | Change | ||||||
|---|---|---|---|---|---|---|---|---|---|
| Loading, please wait... | |||||||||
Continue Researching TFX
Want to see what other sources are saying about Teleflex Inc's financials and stock price? Try the links below:Teleflex Inc (TFX) Stock Price | Nasdaq
Teleflex Inc (TFX) Stock Quote, History and News - Yahoo Finance
Teleflex Inc (TFX) Stock Price and Basic Information | MarketWatch
Loading social stream, please wait...