
Textainer Group Holdings Ltd. (TGH): Price and Financial Metrics
TGH Price/Volume Stats
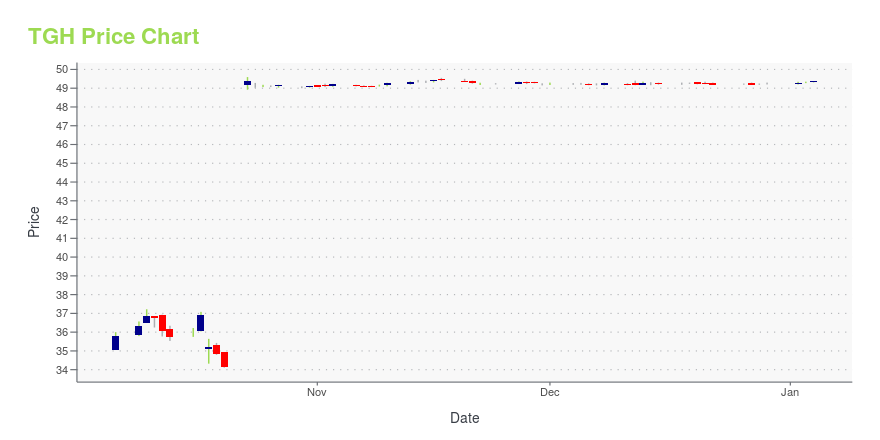
| Current price | $49.99 | 52-week high | $50.15 |
| Prev. close | $49.97 | 52-week low | $30.22 |
| Day low | $49.97 | Volume | 1,175,900 |
| Day high | $50.00 | Avg. volume | 675,690 |
| 50-day MA | $49.71 | Dividend yield | 2.4% |
| 200-day MA | $44.17 | Market Cap | 2.12B |
TGH Stock Price Chart Interactive Chart >
Textainer Group Holdings Ltd. (TGH) Company Bio
Textainer Group Holdings engages in the purchase, ownership, management, leasing, and disposal of a fleet of intermodal containers worldwide. It operates through three segments: Container Ownership, Container Management, and Container Resale. The company was founded in 1979 and is based in Hamilton, Bermuda.
Latest TGH News From Around the Web
Below are the latest news stories about TEXTAINER GROUP HOLDINGS LTD that investors may wish to consider to help them evaluate TGH as an investment opportunity.
Textainer Announces Expiration of “Go-Shop” PeriodHAMILTON, Bermuda and NEW YORK, Nov. 22, 2023 (GLOBE NEWSWIRE) -- Textainer Group Holdings Limited (NYSE: TGH; JSE: TXT) (“Textainer”), one of the world’s largest lessors of intermodal containers, today announced the expiration of the 30-day “go-shop” period under the terms of the previously announced definitive agreement to be acquired by Stonepeak, a leading alternative investment firm specializing in infrastructure and real assets. Under and subject to the terms of the agreement, Stonepeak wi |
Textainer Group Holdings Limited Reports Third-Quarter 2023 Results and Declares DividendHAMILTON, Bermuda, Nov. 02, 2023 (GLOBE NEWSWIRE) -- Textainer Group Holdings Limited (NYSE: TGH; JSE: TXT) (“Textainer”, “the Company”, “we” and “our”), one of the world’s largest lessors of intermodal containers, today reported financial results for the third-quarter ended September 30, 2023. Key Financial Information (in thousands except for per share and TEU amounts) and Business Highlights: QTD Q3 2023 Q2 2023 Q3 2022 Total lease rental income $192,497 $192,163 $205,152 Gain on sale of owne |
Why Textainer Stock Is Skyrocketing This WeekTextainer (NYSE: TGH) stock is seeing big gains in this week's trading. The shipping container specialist was up 43.7% from last week's market close before the market opened this Friday, according to data from S&P Global Market Intelligence. The $50-per-share buyout price for Textainer represented a roughly 46% premium compared to where the stock closed last Friday. |
Textainer Announces Date for the Third Quarter 2023 Earnings ReleaseHAMILTON, Bermuda, Oct. 26, 2023 (GLOBE NEWSWIRE) -- Textainer Group Holdings Limited (NYSE:TGH; JSE:TXT) (“Textainer”, “we” and “our”), one of the world’s largest lessors of intermodal containers, will release third quarter 2023 financial results before the open of regular market trading on Thursday, November 2, 2023. As previously announced on October 22, 2023, Textainer has entered into a definitive agreement to be acquired by Stonepeak. In light of the pending transaction, Textainer will not |
Greenbrier Companies (GBX) Q4 Earnings and Revenues Miss EstimatesGreenbrier (GBX) delivered earnings and revenue surprises of -8.91% and 1.02%, respectively, for the quarter ended August 2023. Do the numbers hold clues to what lies ahead for the stock? |
TGH Price Returns
| 1-mo | N/A |
| 3-mo | N/A |
| 6-mo | 1.27% |
| 1-year | 22.31% |
| 3-year | 80.70% |
| 5-year | 438.31% |
| YTD | 2.22% |
| 2023 | 63.69% |
| 2022 | -10.42% |
| 2021 | 87.63% |
| 2020 | 79.08% |
| 2019 | 7.53% |
TGH Dividends
| Ex-Dividend Date | Type | Payout Amount | Change | ||||||
|---|---|---|---|---|---|---|---|---|---|
| Loading, please wait... | |||||||||
Continue Researching TGH
Want to do more research on Textainer Group Holdings Ltd's stock and its price? Try the links below:Textainer Group Holdings Ltd (TGH) Stock Price | Nasdaq
Textainer Group Holdings Ltd (TGH) Stock Quote, History and News - Yahoo Finance
Textainer Group Holdings Ltd (TGH) Stock Price and Basic Information | MarketWatch
Loading social stream, please wait...