
TEGNA Inc (TGNA): Price and Financial Metrics
TGNA Price/Volume Stats
| Current price | $13.54 | 52-week high | $17.37 |
| Prev. close | $13.65 | 52-week low | $13.18 |
| Day low | $13.51 | Volume | 997,000 |
| Day high | $13.69 | Avg. volume | 2,132,101 |
| 50-day MA | $14.19 | Dividend yield | 3.32% |
| 200-day MA | $15.18 | Market Cap | 2.38B |
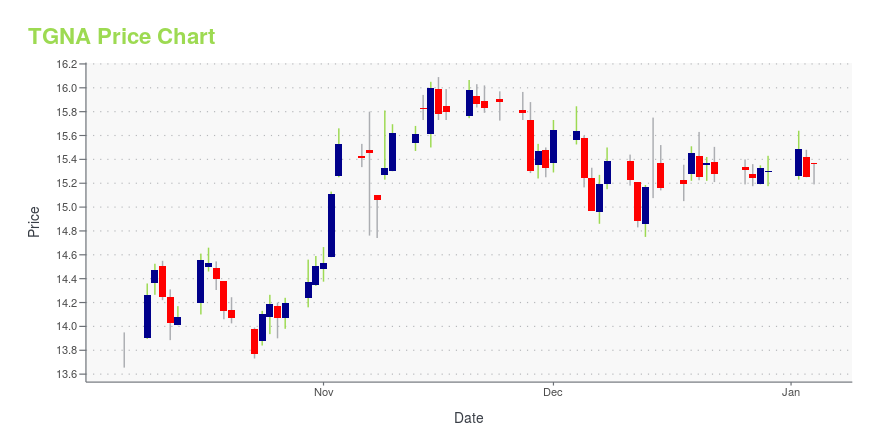
TGNA Stock Price Chart Interactive Chart >
TEGNA Inc (TGNA) Company Bio
TEGNA Inc. operates television stations that produce local programming, such as news, sports, and entertainment; and affiliated online sites. The company was founded in 1906 and is based in McLean, Virginia.
Latest TGNA News From Around the Web
Below are the latest news stories about TEGNA INC that investors may wish to consider to help them evaluate TGNA as an investment opportunity.
TEGNA Names Byron Wilkinson President and General Manager at KVUE in AustinTYSONS, Va., December 18, 2023--TEGNA names Byron Wilkinson president and general manager at KVUE-TV in Austin, Texas. |
TEGNA Names Brian Gregory President and General Manager at WVEC in NorfolkTYSONS, Va., December 11, 2023--Brian Gregory has been named president and general manager at WVEC-TV, TEGNA’s ABC affiliate in Norfolk, Virginia. |
Zacks Industry Outlook Highlights TEGNA, fuboTV and AMC NetworksTEGNA, fuboTV and AMC Networks are part of the Zacks Industry Outlook article. |
3 Broadcast Radio & TV Stocks to Buy in a Prospering IndustryRadio and television broadcast companies, TEGNA (TGNA), fuboTV (FUBO) and AMC Networks, benefit from higher content consumption and steady digital viewing despite intense competition for ad revenues. |
Why Is TEGNA Inc. (TGNA) Down 0.6% Since Last Earnings Report?TEGNA Inc. (TGNA) reported earnings 30 days ago. What's next for the stock? We take a look at earnings estimates for some clues. |
TGNA Price Returns
| 1-mo | -9.37% |
| 3-mo | -13.82% |
| 6-mo | -4.28% |
| 1-year | -18.50% |
| 3-year | -29.50% |
| 5-year | -5.22% |
| YTD | -10.78% |
| 2023 | -25.87% |
| 2022 | 16.22% |
| 2021 | 35.58% |
| 2020 | -14.64% |
| 2019 | 56.42% |
TGNA Dividends
| Ex-Dividend Date | Type | Payout Amount | Change | ||||||
|---|---|---|---|---|---|---|---|---|---|
| Loading, please wait... | |||||||||
Continue Researching TGNA
Want to do more research on Tegna Inc's stock and its price? Try the links below:Tegna Inc (TGNA) Stock Price | Nasdaq
Tegna Inc (TGNA) Stock Quote, History and News - Yahoo Finance
Tegna Inc (TGNA) Stock Price and Basic Information | MarketWatch
Loading social stream, please wait...